|
Home
|
 CCM Client Update New Tool To Help Improve Our Performance PART II April 16, 2010
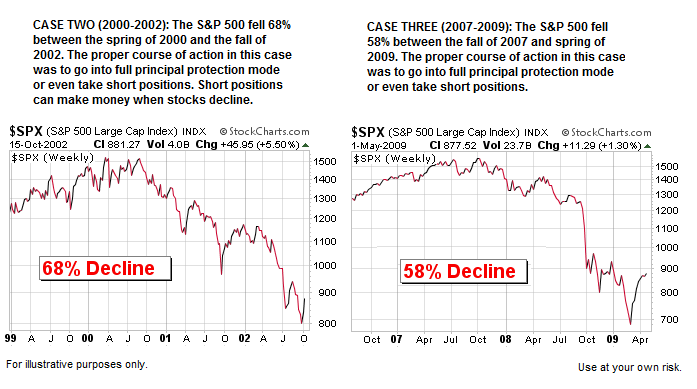
 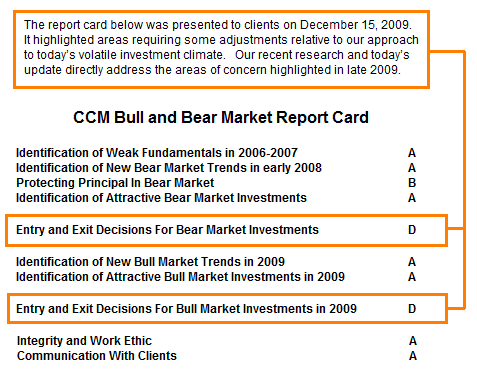 On March 15, 2010, Ciovacco Capital Management (CCM) announced the ongoing development of an objective scoring system, the CCM Bull Market Sustainability Index (CCM BMSI), to help us better discern between a correction in a bull market and the possible onset 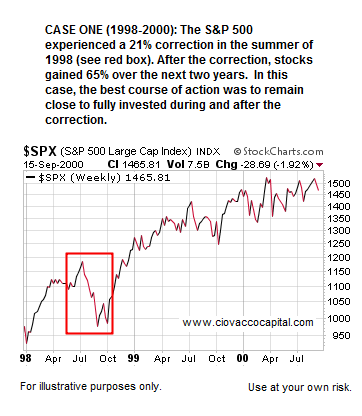 of a new bear market. The objectives of the CCM BMSI are to help us accomplish the following in bull markets: (a) increase holding periods for investments, (b) reduce transactions, and (c) improve long-term performance. The system will also allow us to more quickly recognize the end of the current bull run in risk assets. of a new bear market. The objectives of the CCM BMSI are to help us accomplish the following in bull markets: (a) increase holding periods for investments, (b) reduce transactions, and (c) improve long-term performance. The system will also allow us to more quickly recognize the end of the current bull run in risk assets.Over the past month we have been working long hours conducting research to improve and refine the CCM BMSI. In this update, we will show how the CCM BMSI will be used under different market conditions. Our focus will be on the three historical cases shown to the right and below. We will also demonstrate how the CCM BMSI would have improved our performance in 2009 and 2010. We are very confident that the creation of the CCM BMSI and its use will result in improved long-term investment performance for all clients. In this update, we will also show additional market indicators and overlays that have been added to the CCM BMSI in recent weeks. While not shown in the graphs below, our study period used in the development of the CCM BMSI went back 30 years to 1981. Over time, the study period will be extended, reaching back to the 1920s for some indicators and overlays.
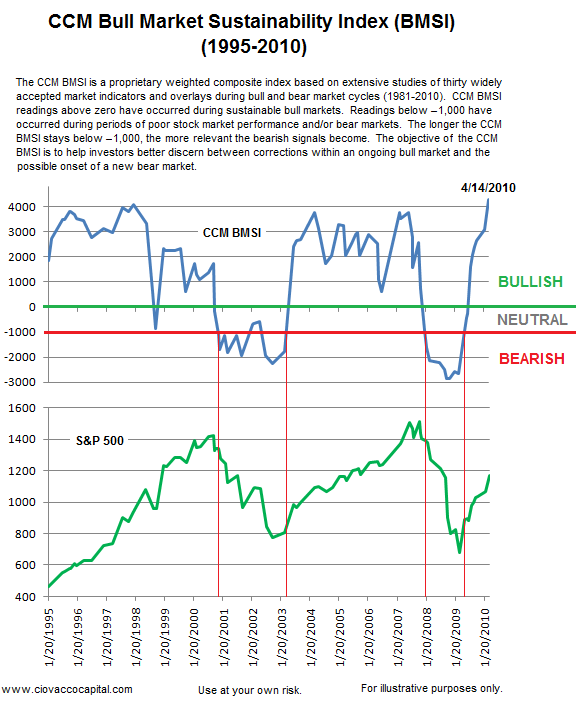
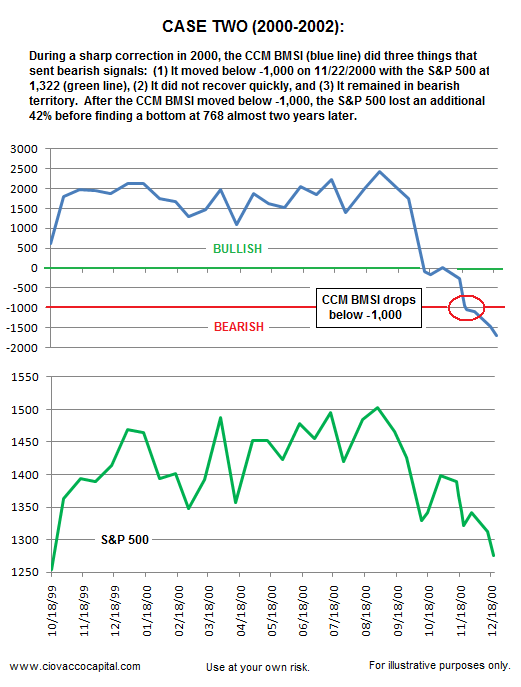
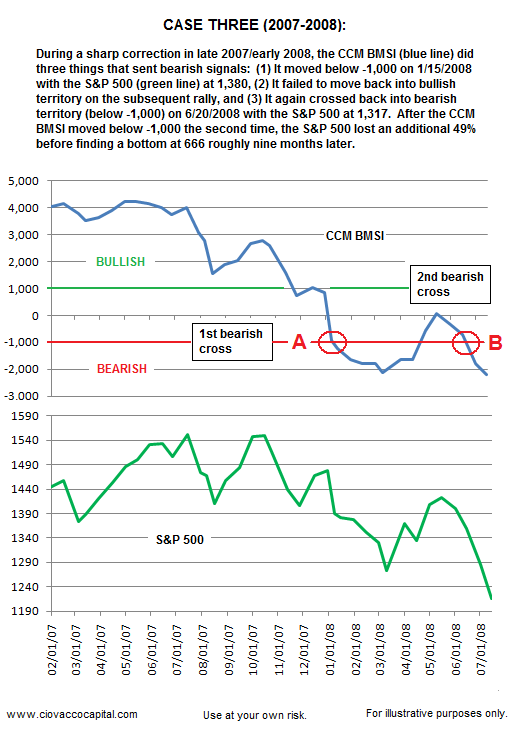
The current 2010 CCM BMSI reading is shown on the right side of the first chart below. We will closely monitor changes to the CCM BMSI during future periods of volatility and market weakness. The thin vertical red lines in the chart below show the value of the S&P 500 Index when the CCM BMSI gave bearish signals (moved below -1,000) and remained in bearish territory. Notice the objective of the system is not to identify major market tops, but to identify weak markets that could morph into full-blown bear markets.
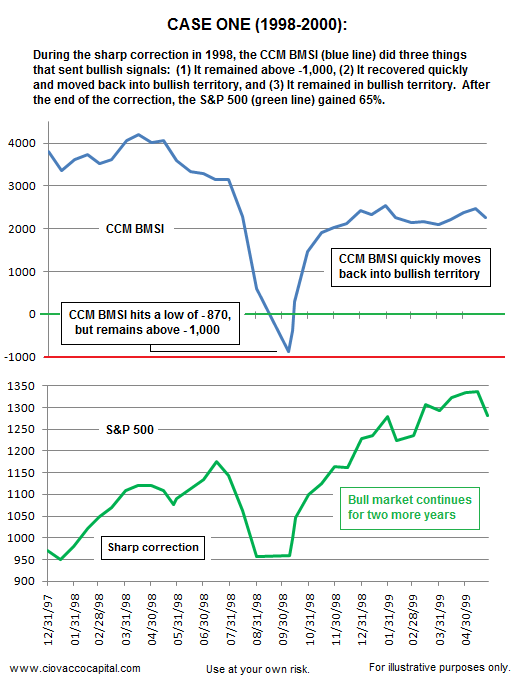
 While some defensive moves may have been in order, the 1998 case (below) turned out to be a relatively short correction within an ongoing bull market. Readings on the CCM BMSI remained in either bullish or neutral territory during the entire correction, signaling that most portfolio positions should have been held despite the volatility. Volatility in healthy markets should not be treated in the same manner as volatility in weaker markets; the CCM BMSI can help us better discern between the two situations.
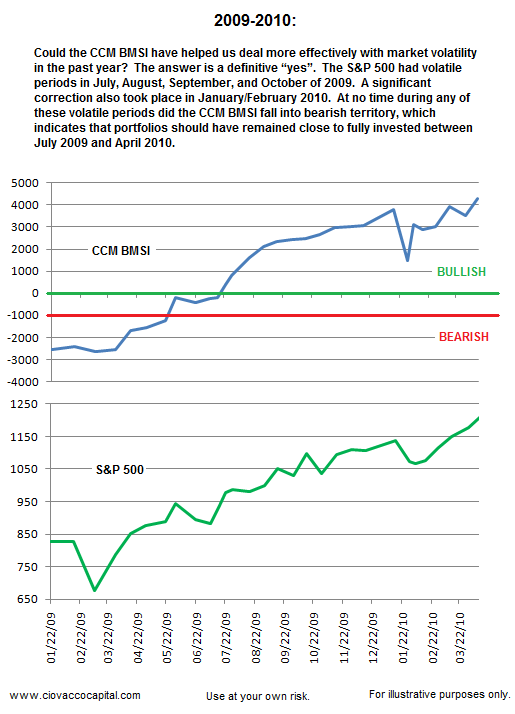
   The volatile state of the financial markets was clearly evident when the S&P 500 dropped 9.2% in 12 trading days in late January/early February 2010. While some market indicators produced bearish readings, the CCM BMSI held firmly in bullish territory. The CCM BMSI was created to help us better discern between volatility that should be ignored and volatility that should be respected. With this new tool, we should be able to confidently hold our positions during periods of bull market volatility. We will also be able to err on the side of protecting capital when market conditions have deteriorated to a point where the risk/reward ratio becomes unfavorable. Future readings between -1,000 and zero on the CCM BMSI will cause us to question the sustainability of the current bull market.
 The reading on the BMSI as of 4/14/2010 was 4,295, which is well into bullish territory. However, the current healthy, but extended state of the markets leaves the door open to corrective activity in the near-term. The good news is that the odds of moving from the current bullish state to a full-fledged bear market, without some intermediate weakening of market internals, is low. Said another way, the next correction, even a sharp one, is not likely to usher in a new bear market.
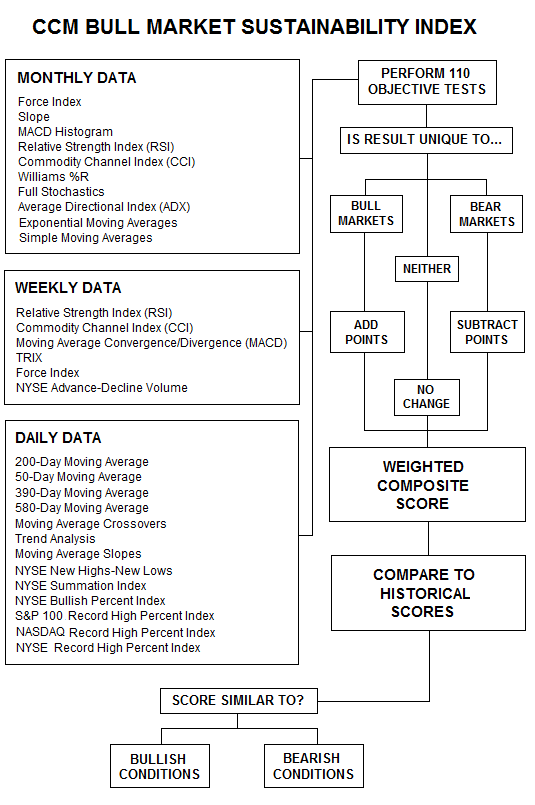
CCM BMSI Data Sets And ProcessSince our last update concerning the CCM BMSI, we have incorporated additional tests and indicators that make up a single weighted composite score. The logic flow of the chart below is from left to right and from top to bottom.
 During the next corrective action in stocks, which is inevitable at some point, we will use this new tool to help better discern between a correction and the possible beginning of a new bear market. We will continue to conduct research in this area and adjust the CCM BMSI as needed.
Balance Of 2010: Strong Dollar ConcernsBudgetary problems continue to put a strain on the euro, which has contributed significantly to a stronger than expected dollar in recent months. A strong dollar has muted the relative strength of many assets that tend to lead at this stage of an economic recovery, including commodities and emerging market stocks. With other nations in the European Union carrying heavy debt burdens, it is possible the euro remains under pressure for an extended period. Consequently, it is prudent to consider adding some assets to our portfolios that are impacted less by a strong dollar. Our models continue to favor the following for the balance of 2010:
Additional comments can be found in Short Takes.
Chris Ciovacco
Chris Ciovacco is the Chief Investment Officer for Ciovacco Capital Management, LLC. More on the web at www.ciovaccocapital.com Terms of Use. The charts and comments are only the author's view of market activity and aren't recommendations to buy or sell any security. Market sectors and related ETFs are selected based on his opinion as to their importance in providing the viewer a comprehensive summary of market conditions for the featured period. Chart annotations aren't predictive of any future market action rather they only demonstrate the author's opinion as to a range of possibilities going forward. All material presented herein is believed to be reliable but we cannot attest to its accuracy. The information contained herein (including historical prices or values) has been obtained from sources that Ciovacco Capital Management (CCM) considers to be reliable; however, CCM makes no representation as to, or accepts any responsibility or liability for, the accuracy or completeness of the information contained herein or any decision made or action taken by you or any third party in reliance upon the data. Some results are derived using historical estimations from available data. Investment recommendations may change and readers are urged to check with tax advisors before making any investment decisions. Opinions expressed in these reports may change without prior notice. This memorandum is based on information available to the public. No representation is made that it is accurate or complete. This memorandum is not an offer to buy or sell or a solicitation of an offer to buy or sell the securities mentioned. The investments discussed or recommended in this report may be unsuitable for investors depending on their specific investment objectives and financial position. Past performance is not necessarily a guide to future performance. The price or value of the investments to which this report relates, either directly or indirectly, may fall or rise against the interest of investors. All prices and yields contained in this report are subject to change without notice. This information is based on hypothetical assumptions and is intended for illustrative purposes only. PAST PERFORMANCE DOES NOT GUARANTEE FUTURE RESULTS.
|
