|
Home
Short Takes
|
Forecasting: Calling Stock Market Bottoms and Tops Can Be Hazardous To Returns
These historical examples show how investors should be careful and skeptical when talking-heads or experts make calls for stock market bottoms or stock market tops. Rather than focusing too much attention on stock market forecasts, investors are better served to pay attention to the current market with an open mind, which is the real objective and utility of technical and fundamental analysis.
From 2008-2009:
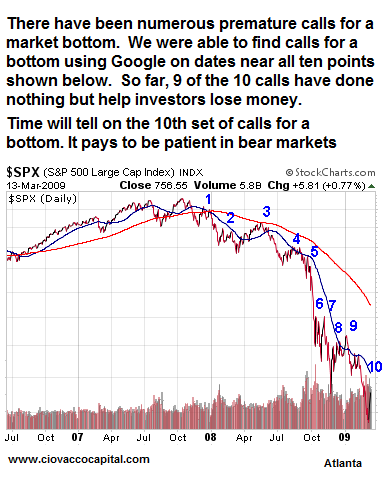
As many continue to call a bottom in stocks, it is prudent to keep in mind the dangers of listening to anyone's forecast for the financial markets. Rather than worrying about forecasting, investors would be better served to think in terms of probabilities associated with numerous outcomes, both favorable and unfavorable. Below are numerous calls for a bottom in stocks.
Our intent is not to call anyone out, but rather to illustrate the dangers of making investment decisions based on anyone's forecast. We fully aware this bear market has been difficult for everyone. We also acknowledge the press likes to use the headline "Calls A Market Bottom" which can sometimes misrepresent the full context of the forecast. As a result, the general public should be careful not to overreact to sensational headlines concerning bullish scenarios for the financial markets. In fairness to those quoted below, they may have changed their forecast since the date of the quote, or even decided to go short [a bearish call]. Other forecasters may have used stop-loss orders and exited the markets soon after their call for a bottom. In either case and in most instances, the general public would not hear about the revised forecast or know about the stop-loss orders - providing other reasons to avoid investing based on forecasts.
Label 1 - December 14, 2007 - Source: Financial Post:
Investor Pessimism Points to a Rally: Ron Meisels, a technical analyst at Phases & Cycles, noted that investor sentiment at a stock market peak leans toward greed, enthusiasm and euphoria. On the other hand, sentiment swings to fear, disappointment and disbelief when it is at a trough -- meaning that today's setbacks in the market are signs that a new bull market is on the way."In October, 2002, it was the same thing. People were confused, nobody really believed we were in the beginning of a bull market, and so we had hectic days," Mr. Meisels said.
From December 14, 2007 to March 9, 2009, the S&P 500 Index lost 54%. If you lose 54%, you need to make 117% to get back to break even. Here is the specific math: Start with $100,000. A 54% loss means a loss of $54,000, leaving you $46,000. $46,000 x 117.39% = $54,000. $46,000 + $54,000 gets you back to $100,000. Investing based on forecasts can be very costly to your long-term net worth.
Label 2 - December 22, 2007 - Source: Fox News:
Fox News Guest Calls A Bottom:
Neil Cavuto: "Charles, do you think that we are near a bottom here, and like with stocks, it's a good time to buy?"
Charles Payne:: "Without a doubt, there are a whole lot of folks out there who are waiting for the bottom. I worry they're going to get too cute. I saw the same thing happen to people in the stock market in 2002-2003. Nobody wanted to buy then because they were waiting and waiting. We hit the bottom and then we went up. And people waited for a double bottom."
From December 22, 2007 to March 9, 2009, the S&P 500 Index lost 54%. If you lose 54%, you need to make 117% to get back to break even.
Label 2 - January 23, 2008 - Source: 247WallStreet
Cramer Calls A Bottom & Gives Play Book Picks (C, CVS, COST, GES, JCG, IBM, DD):
On tonight's MAD MONEY on CNBC, Jim Cramer said emphatically that the huge drop today followed by the monster rally in the same day is a classic bottoming pattern, although he thinks that the move was too quick and he wouldn't be surprised if we pull back over the next couple of days. When you see the action like this the financial stocks and the retailers that have been the most bettered become the best places to jump in. Here are his play book picks from retail stocks and financial stocks as the sector rotation trades comes into play: Jim Cramer went out and said he believes that Citigroup (NYSE: C) has actually bottomed.
From January 23, 2008 to March 9, 2009, the S&P 500 Index lost 50%. If you lose 50%, you need to make 100% to get back to break even.
Label 3 - February 4, 2008 - Source: Bloomberg:
Insider Buys Exceed Sales, Signaling Market Bottom: Chief executive officers, directors and other senior officials in corporate America are buying more of their companies' shares than they're selling for the first time since 1995, prompting growing confidence the stock market is poised to rally for the rest of the year.
From January 4, 2008 to March 9, 2009, the S&P 500 Index lost 51%. If you lose 51%, you need to make 104% to get back to break even.
Label 3 - March 27, 2008 - Source: Forbes
Dear Abby [Mr. Ken Fisher's column]: I'm getting a lot of hate e-mail these days. This onslaught is not entirely a bad thing. It reassures me that my bet against the crowd is a wise one. I'm bullish and have been steadily since the July 8, 2002 issue. In my Jan. 28 column I reiterated the upbeat outlook and reminded you that the fourth year of a presidency only rarely delivers losses to stockholders. Now, with stocks globally (as measured by the Morgan Stanley All-Country World Index) down 8.6% so far this year, people are telling me I'm an idiot. Someone posted to FORBES Web site, "Hi Ken. It's been an absolute pleasure watching you vie for the 2008 Henry Blodget Award. Keep up the good work!" Gloat for now, but please note that 2008 isn't over. I still think the year will end in the plus column.
From March 27, 2008 to March 9, 2009, the S&P 500 Index lost 49%. If you lose 49%, you need to make 96% to get back to break even.
Label 3 - May 18, 2008 - Source: New York Times:
An Alarm Is Blaring: Time to Buy:
The Recession Buy Indicator is triggered when - as is the case today - each of these four gauges is below its level of six months earlier. On such occasions, Mr. Fosback considers the economy to be in a recession or very close to it. He agreed that many people might be wary of plunging into the market when the economic news is so bad. But, he added, his indicator is a classic illustration of the virtues of contrary opinion: "When everything seems gloomy, it's time for the smart money to buy."
From May 18, 2008 to March 9, 2009, the S&P 500 Index lost 53%. If you lose 53%, you need to make 113% to get back to break even.
Label 4 - Aug 29, 2008 - Source: The Star:
Financials, Builders Have Likely Hit Bottom:
I [Bill Carrigan] now think the front end of the market has bottomed, which is the first phase of a new bull market. Remember, first to peak, first to bottom.
Our chart this week is that of the weekly closes of two important front end components, the U.S.-listed SPDR Homebuilders ETF (XHB) and the TSX-listed iShares CDN Financial ETF (XFN). In the normal course of a downtrend, an index or stock will make a series of new lows, usually every 12 weeks, but that is not the case in these two examples. Note the upper plot is trading above the lowest low of 34 weeks ago and the lower plot is trading above the lowest low of 24 weeks ago. That tells me we have seen the lows in the front end in this market cycle.
From August 29, 2008 to March 9, 2009, the S&P 500 Index lost 47%. If you lose 47%, you need to make 89% to get back to break even.
Label 5 - October 2, 2008 - Source: Times Online
Fidelity's Anthony Bolton Calls Bottom of Stock Market:
Anthony Bolton, London's best-known stockpicker, said yesterday that he had never seen retailing and media shares looking so cheap and that he had begun to put his own money into the equity market at the height of the current financial crisis. Mr. Bolton, president for investments at Fidelity International, said that the UK stock market seemed to be at or near the bottom and he had become much more optimistic in the past two weeks. "Shares [in some sectors] are as cheap as I've seen them in my lifetime," he said, citing consumer cyclical sectors such as retailing and media as particular bargains. After pausing several years in adding to his stock market investments, he said he had put fresh personal money into Fidelity equity funds two weeks ago and on Monday - the day the US bank bailout plan was derailed. "For the first time in a couple of years, in the last few weeks I've started to feel optimistic," he said. The bear market had gone on too long and, at 15 months, was already "long in the tooth" compared with previous share market slides. "In the last two weeks we have looked into the abyss that you get at the bottom [of each bear market]," he said.
From October 2, 2008 to March 9, 2009, the S&P 500 Index lost 39%. If you lose 39%, you need to make 64% to get back to break even.
Label 6 - October 9, 2008 - Source: Trader's Narrative
Tony Oz Calls The Stock Market Bottom:
Tony Oz is thinking along the same lines and believes the market is near a significant bottom here. He bought a bit over $500,000 worth of SPY today and will buy more if the market declines again. I'm glad to see someone like Tony Oz confirm my own thinking that we are close to a bottom - otherwise, we might as well just flee to the hills and look for a nice cave to hunker down in. Unlike, Jim Cramer, Tony Oz makes infrequent public market calls, so when he does, it merits attention. Poor Cramer (CNBC), he just may come to regret his somber advice for people to get out. But then again, knowing him, he will have no problem in sweeping that under the rug, along with all his other unprofitable calls which he never revisits.
From October 9, 2008 to March 9, 2009, the S&P 500 Index lost 26%. If you lose 26%, you need to make 35% to get back to break even.
Label 7 - October 29, 2008 - Source Blogging Stocks:
Jim Stack: Market Historian Calls 'Imminent' Bottom:
Written before yesterday's sharp rise, stock market historian and advisor Jim Stack had forecast an "imminent bottom" for the market. A long-term timer, he is not looking for quick pops and drops; rather, the "safety-first" money manager focuses on slowing positioning his portfolio for long-term, secular trends. Indeed, in his InvesTech Market Analyst he was among the few to accurately forecast the current crisis; over the prior year and a half, he predicated both the bust of the housing bubble and the derivatives-based meltdown that would result.
After maintaining a defensive, cash-heavy portfolio during the market's downturn, he is now becoming more optimistic, noting, "All of our bearish extremes readings that precede the best stock buy opportunities are now in place."
From October 29, 2008 to March 9, 2009, the S&P 500 Index lost 27%. If you lose 27%, you need to make 37% to get back to break even.
Label 7 - November 2008 Issue - Source: Kiplinger's Personal Finance Magazine
Stock investors should "beat the rush to the banks."
[from Kiplinger's Personal Finance article, The Worst Media Calls of 2008]
From November 1, 2008 to March 9, 2009, the S&P 500 Index lost 30%. If you lose 30%, you need to make 43% to get back to break even.
Label 8 - December 4, 2008 - Source: U.S. News & World Report
Bill Miller Calls A Bottom: At Legg Mason's annual media luncheon Wednesday, star fund manager Bill Miller said "the bottom has been made" in U.S. stocks.
From December 4, 2008 to March 9, 2009, the S&P 500 Index lost 20%. If you lose 20%, you need to make 25% to get back to break even.
Label 8 - December 5, 2008 - Source: New York Times
Seabreeze's Kass Calls the Bottom for Stocks: The hedge-fund manager Doug Kass, who successfully shorted United States equities this year, including shares of Fannie Mae and Freddie Mac, is now buying American stocks on the belief that they have hit bottom. "What are deemed to be risky, that is equities, are becoming safer and I am gingerly buying, Mr. Kass, the founder and president of Unnamed Partners Management, told Reuters.
From December 5, 2008 to March 9, 2009, the S&P 500 Index lost 23%. If you lose 23%, you need to make 30% to get back to break even.
Label 8 - December 8, 2008 - Source Bloomberg
Birinyi Says Investors Should Lose "Bunker Mentality": Laszlo Birinyi, the investor who accurately predicted this year's rout in financial shares, said the Standard & Poor's 500 Index reached a bear market bottom two weeks ago and recommended buying the largest U.S. stocks. "I'm very comfortable saying the market has made the bottom," Birinyi, president of Birinyi Associates Inc. in Westport, Connecticut, said in an interview with Bloomberg Television. "It's time to get out of the bunker mentality. You want to be looking at stocks, you want to be considering the market, and you want to get out of this funk that too many investors have been in for the last three or four months."
From December 8, 2008 to March 9, 2009, the S&P 500 Index lost 26%. If you lose 26%, you need to make 35% to get back to break even.
Label 9 - December 27, 2008 - Source: Star Tribune:
Despite the uncertain times, market experts predict that 2009 could be a good year for stocks: As for 2009? The panel was surprisingly optimistic. "The buying opportunities in the marketplace today are unheard of," said Beth Q. Public, a small-cap mutual fund manager for Nameless Funds.
"I think we saw a major, major bear market bottom on November 20," said Steve Q. Public, founder and chief investment officer of the Nameless Group. "The market turns up about halfway through a recession. Here we are folks. Right now."
From December 27, 2008 to March 9, 2009, the S&P 500 Index lost 22%. If you lose 22%, you need to make 28% to get back to break even.
Label 9 - January 14, 2009 - Source: Reuters
Deutsche calls bottom to Wall Street: US stocks may have hit their bottom last November and are likely to stabilize by the second half of 2009, coinciding with an expected upturn in the economy, a top strategist at Deutsche Bank said overnight. "Equities may have bottomed because historically a bottom is hit midway into the recession," said Chadha. And with the US economy already in its 14th month of recession, "we think the November lows could hold," he added, noting that troughs in equities have occurred side by side with bottoms in economic growth.
From January 14, 2009 to March 9, 2009, the S&P 500 Index lost 20%. If you lose 20%, you need to make 25% to get back to break even.
When stocks rally in a bear market, it is easy to feel we are missing something. Even after this week's "powerful rally" in stocks, the S&P 500 Index remains 52% below its October 2007 high of 1,576. The cruel reality of percentages is a buy and hold investor who earns back 52% from today's close on the S&P 500 of 756 would only get back to an S&P 500 equivalent of 1,149 or 427 points short of 1,576. From today's close of 756, the S&P 500 would have to gain 109% to get back to the October 2007 high of 1,576. The math: (756 x 109% = 824.04) (756 + 824.04 = 1,580) or 4 points above the October 2007 high. When you fully appreciate how difficult it is to overcome large losses, you gain a better appreciation for the need to not "jump the gun" and force money into a market that is not yet giving enough positive signals. Principal is precious as many investors have learned the hard way in this bear market.
Chris Ciovacco
Ciovacco Capital Management

Chris Ciovacco is the Chief Investment Officer for Ciovacco Capital Management, LLC. More on the web at www.ciovaccocapital.com
All material presented herein is believed to be reliable but we cannot attest to its accuracy. The information contained herein (including historical prices or values) has been obtained from sources that Ciovacco Capital Management (CCM) considers to be reliable; however, CCM makes any representation as to, or accepts any responsibility or liability for, the accuracy or completeness of the information contained herein or any decision made or action taken by you or any third party in reliance upon the data. Some results are derived using historical estimations from available data. Investment recommendations may change and readers are urged to check with tax advisors before making any investment decisions. Opinions expressed in these reports may change without prior notice. This memorandum is based on information available to the public. No representation is made that it is accurate or complete. This memorandum is not an offer to buy or sell or a solicitation of an offer to buy or sell the securities mentioned. The investments discussed or recommended in this report may be unsuitable for investors depending on their specific investment objectives and financial position. Past performance is not necessarily a guide to future performance. The price or value of the investments to which this report relates, either directly or indirectly, may fall or rise against the interest of investors. All prices and yields contained in this report are subject to change without notice. This information is based on hypothetical assumptions and is intended for illustrative purposes only. PAST PERFORMANCE DOES NOT GUARANTEE FUTURE RESULTS.
|