|
Home
|
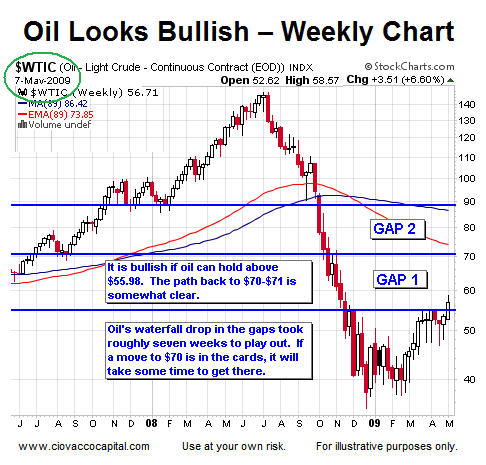
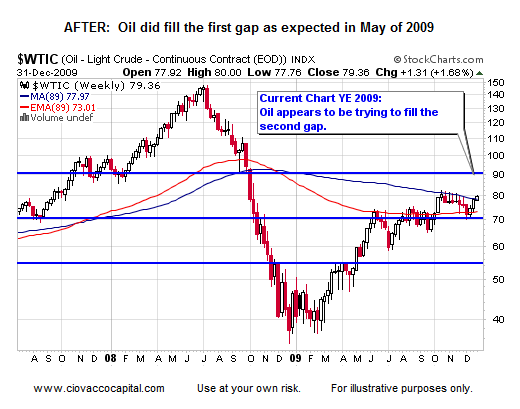
Using Gaps On Weekly Stock Market ChartsOn May 8, 2009, we presented the chart below of crude oil, when oil was at $58.57. The chart from May 8, 2009 stated, "If oil can hold above $55.98, the path back to $70-71 is somewhat clear." Oil ended 2009 at $79.36 or 35% higher than the day we published the chart below. The chart below is still posted on the Internet in the Short Takes archives. We still believe that oil can reach approximately $88 to $90 during its next leg up. It is the main reason we held oil during a recent correction.
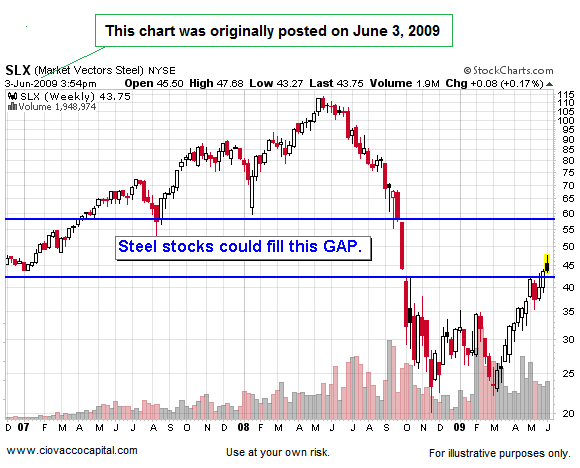
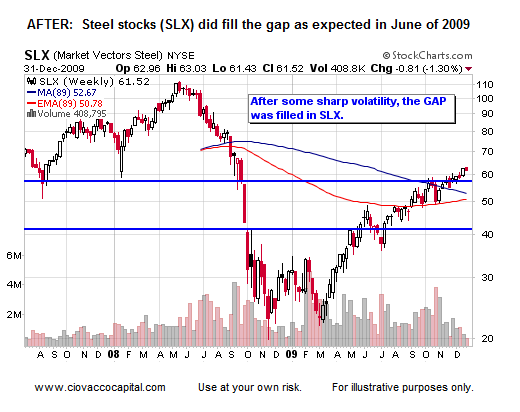
 On June 3, 2009, we presented the chart below of the steel stocks ETF (SLX). SLX was trading at 43.75. SLX ended 2009 at 61.52 or 40.6% higher than the day we posted the chart below on Short Takes. The chart remains in the Short Takes archives. We fully understand that all of this does you no good as a client; in fact it is just extremely frustrating to see that we did many things right in 2009, but were unable to fully capitalize in terms of profits. Our problem with steel stocks was quite simple, we placed too high an emphasis on principal protection during subsequent corrections and left the market prior to being able to profit from proper trend identification. We know how to correct our problems - we have every intention of doing so in 2010.
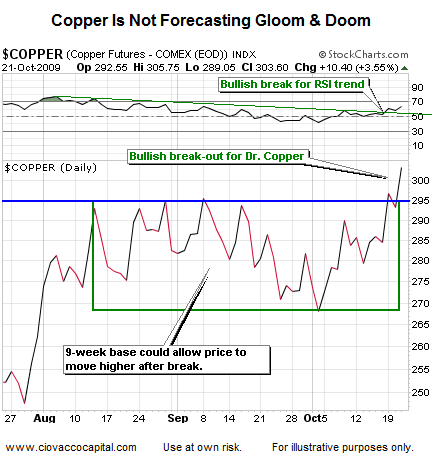
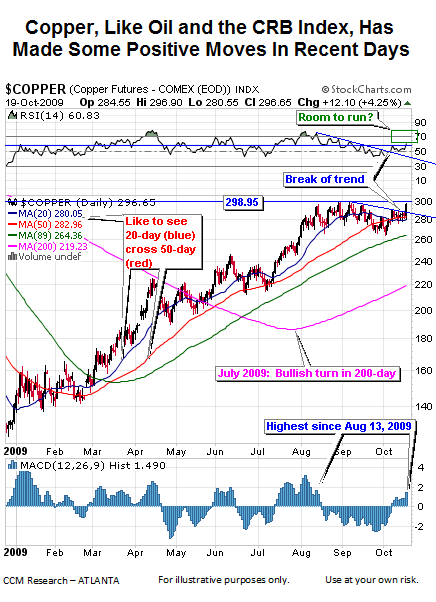 A few days later on October 21, 2009, we posted the chart below of Copper's bullish breakout. Copper's breakout held and offered a good risk/reward entry point with 9-weeks of support below price.
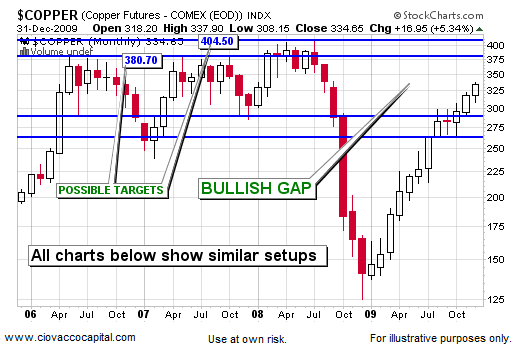
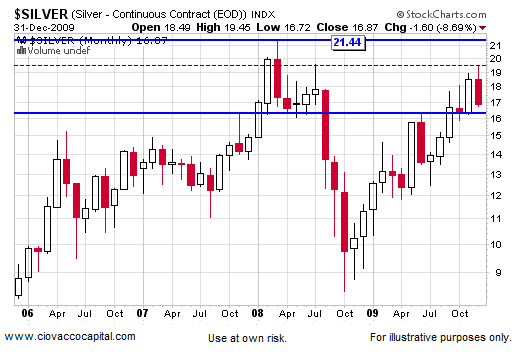
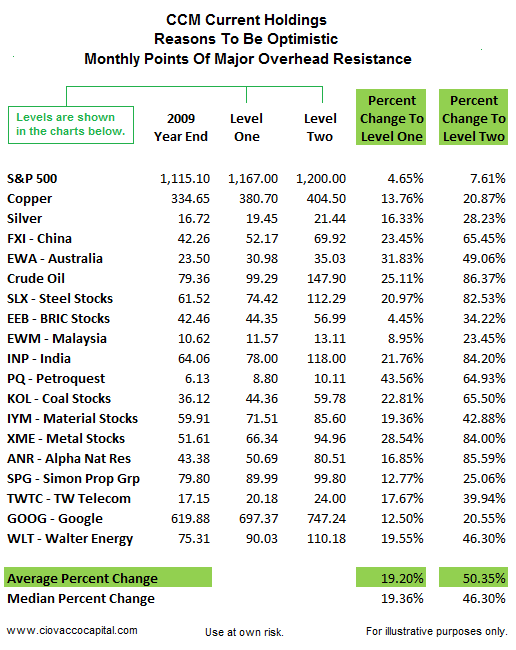
Current Holdings: We Still Have A Great Opportunity In 2010The charts below are all from the present day. They have similar bullish set-ups that were present in oil, steel stocks, and copper in 2009. The table at the top of this update summarizes the percentage change between current prices and major areas of overhead resistance that could be reached in the current bull market. Monthly charts help filter out some volatility and allow us to more clearly see upside potential. All charts below are monthly charts.
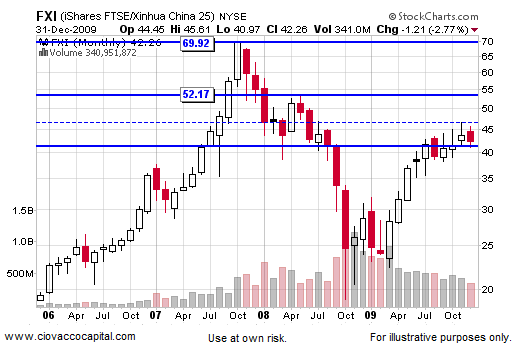
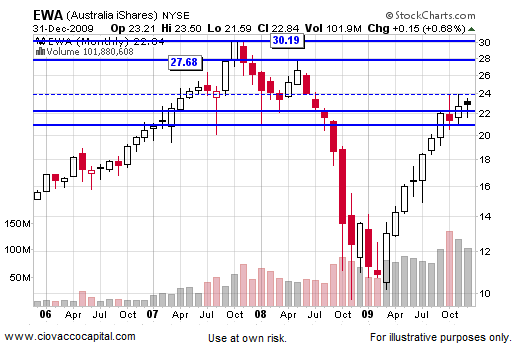
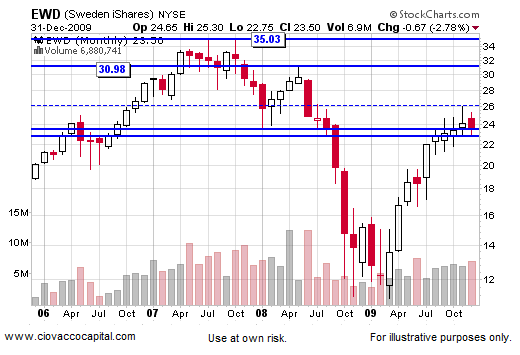
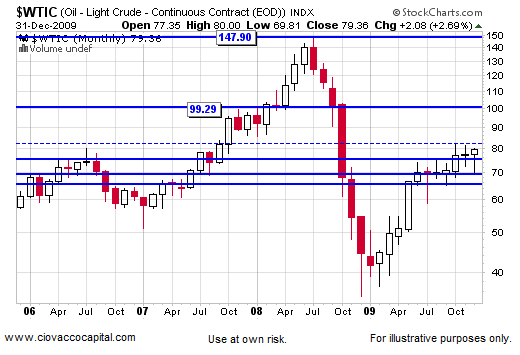
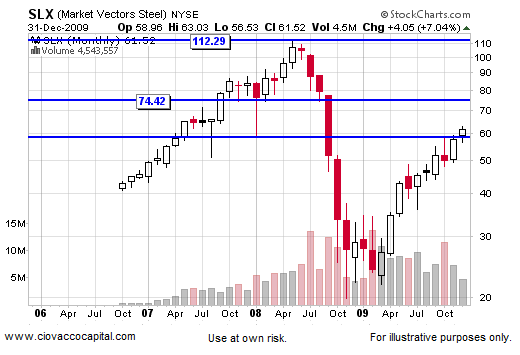
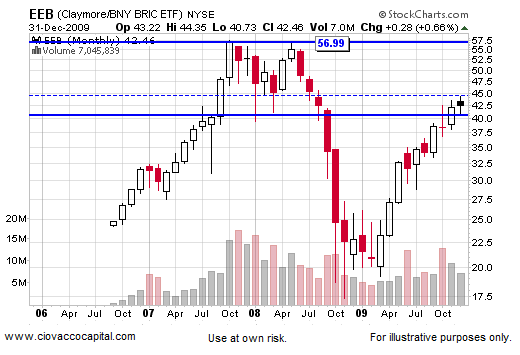
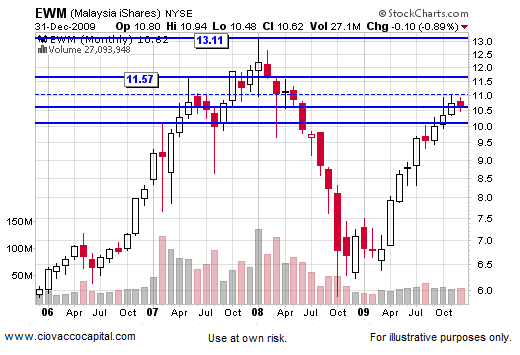
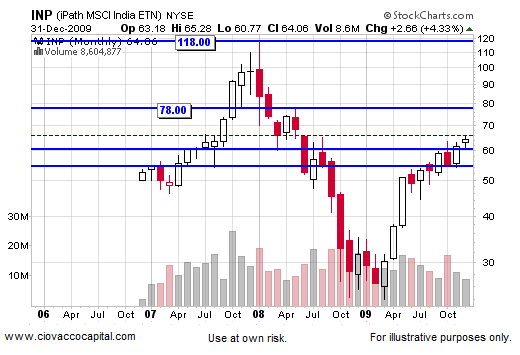
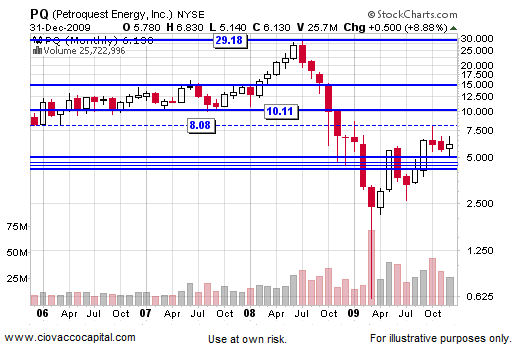
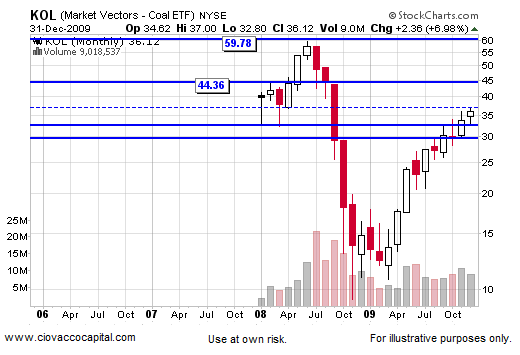
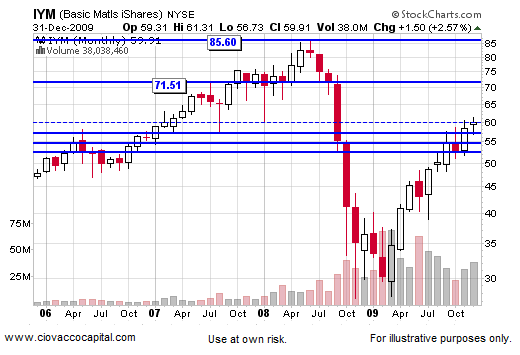
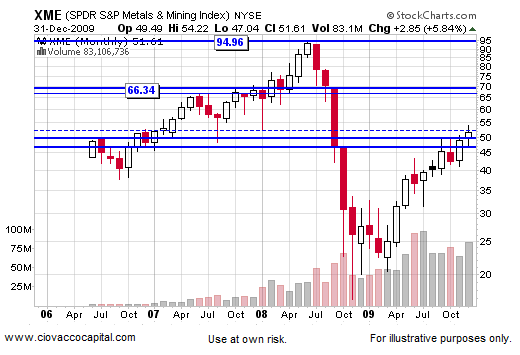
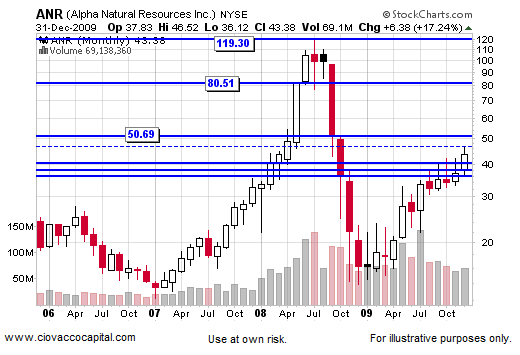
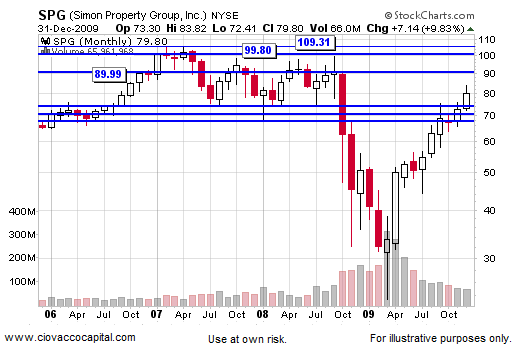
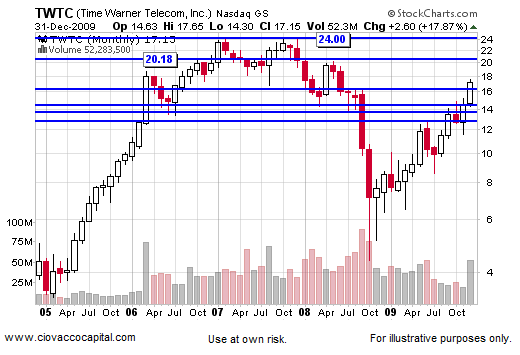
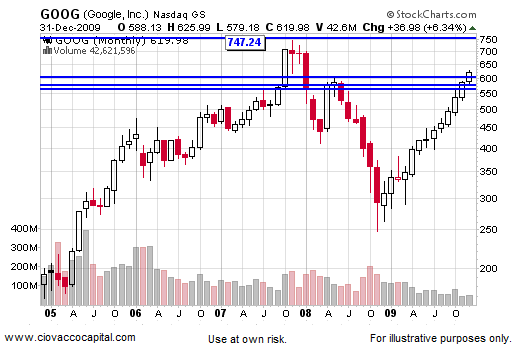
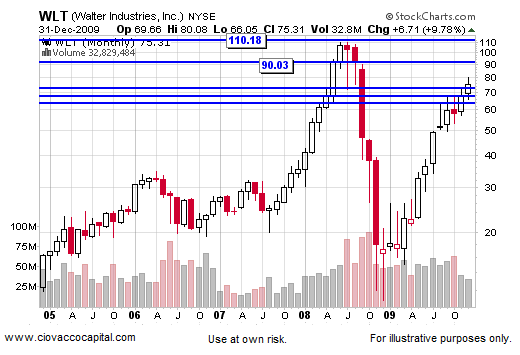
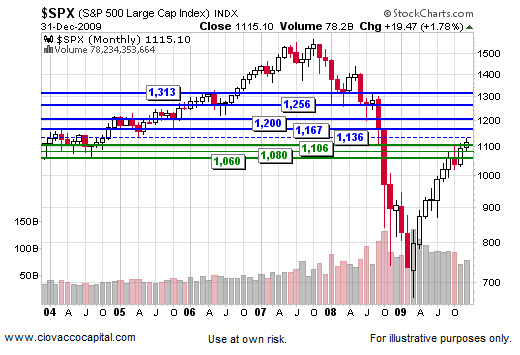
 Reasons To Be Optimistic In 2010 CCM Research We have a good foundation to build on as we head into 2010. While we need to make some changes relative to the difficult balance between protecting principal and staying invested to profit from good decisions in the areas of trend identification and security selection, we have had success identifying markets with upside potential. In this update, we will show some 2009 before and after charts. Then, we will show you charts of our current holdings that have similar positive characteristics as we head into 2010. The current charts show some excellent opportunities if we can be patient and remain invested during inevitable corrections. The table below summarizes what is shown in the charts of our current holdings.
 We feel it is important for CCM clients to understand what we did well in 2009 (identify trends and attractive markets) and what we did not do so well (staying invested during corrections). As a client, despite recent frustrations, there is a sound basis to stay the course in the coming year.
Holding On During Corrections May Be The Key In 2010The charts above and the percentage figures in the opening table are not presented as predictions of future events. No one can accurately predict the future on a consistent basis. However, we do know and understand the following:
Within this context, the odds continue to favor higher asset prices at the end of 2010. How (and if) we get there remains to be seen. We can and should expect some painful corrections along the way. As long as markets correct within the context of an ongoing bull market, we should err on the side of remaining invested in order to greatly increase our chances of being profitable at the end of 2010. In order to do this, we must take a longer-term focus during periods of market volatility and increased levels of fear. Our task at CCM is to discern between corrections within a bull market and the possible onset of a new bear market. Our extensive studies of past market cycles should allow us to be up to the task.
Chris Ciovacco
Chris Ciovacco is the Chief Investment Officer for Ciovacco Capital Management, LLC. More on the web at www.ciovaccocapital.com Terms of Use. The charts and comments are only the author's view of market activity and aren't recommendations to buy or sell any security. Market sectors and related ETFs are selected based on his opinion as to their importance in providing the viewer a comprehensive summary of market conditions for the featured period. Chart annotations aren't predictive of any future market action rather they only demonstrate the author's opinion as to a range of possibilities going forward. All material presented herein is believed to be reliable but we cannot attest to its accuracy. The information contained herein (including historical prices or values) has been obtained from sources that Ciovacco Capital Management (CCM) considers to be reliable; however, CCM makes no representation as to, or accepts any responsibility or liability for, the accuracy or completeness of the information contained herein or any decision made or action taken by you or any third party in reliance upon the data. Some results are derived using historical estimations from available data. Investment recommendations may change and readers are urged to check with tax advisors before making any investment decisions. Opinions expressed in these reports may change without prior notice. This memorandum is based on information available to the public. No representation is made that it is accurate or complete. This memorandum is not an offer to buy or sell or a solicitation of an offer to buy or sell the securities mentioned. The investments discussed or recommended in this report may be unsuitable for investors depending on their specific investment objectives and financial position. Past performance is not necessarily a guide to future performance. The price or value of the investments to which this report relates, either directly or indirectly, may fall or rise against the interest of investors. All prices and yields contained in this report are subject to change without notice. This information is based on hypothetical assumptions and is intended for illustrative purposes only. PAST PERFORMANCE DOES NOT GUARANTEE FUTURE RESULTS.
|
