|
Home
|
 CCM Client Update Intermediate-Term Concerns February 24, 2010
While the long-term bull market remains in place, we currently see some concerning developments on both the fundamental and technical fronts that we are monitoring closely. Given what we know today, we are going to err on the side of protecting capital in the weeks ahead.
If markets can break above some key levels shown in the charts below, then our concerns would be greatly reduced. The purpose of the analysis below is to understand probable outcomes. A multi-month correction is now a higher probability outcome than it was in early January 2010, but far from a certainty. If markets and fundamental developments continue to point toward a corrective process, we will consider reducing our exposure to risk if needed. The charts shown below are heavily biased toward negative set-ups, meaning we also are aware of several positive set-ups (not shown). Given some recent weak economic reports (lending, consumer confidence, housing, employment), we feel it is important to look at both positive and negative probable future outcomes.
 At this stage of the economic cycle, investors tend to become concerned about:
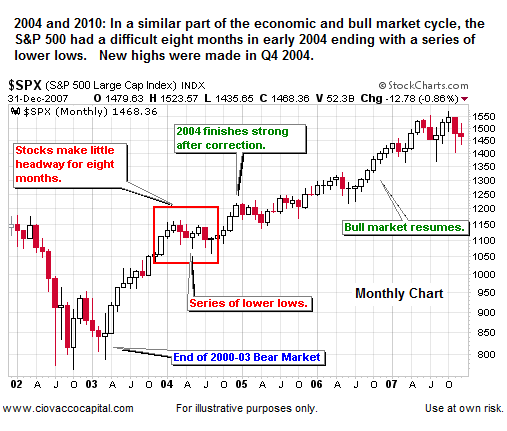
Consequently, significant corrections often occur after the initial move from the prior bear market's lows. If history is a guide, the correction would enable stocks and other risk assets to make higher highs as pessimism increases over the coming months. Increased pessimism and corrections are typical at this stage of the economic and market cycle, so we should not be surprised if the mood and asset prices deteriorate for a few months. Markets can be cruel; the eight month corrective period in 2004 was just long enough to:
In 2010, it is possible that we are in a similar multi-month corrective process that will again cause many investors to throw in the towel. Investors who can maintain a longer-term focus during inevitable multi-month corrections have a much higher probability of being successful in the next three to five years. Fear often prevents investors from making money over longer periods of time, especially in the early stages of a new bull market cycle.
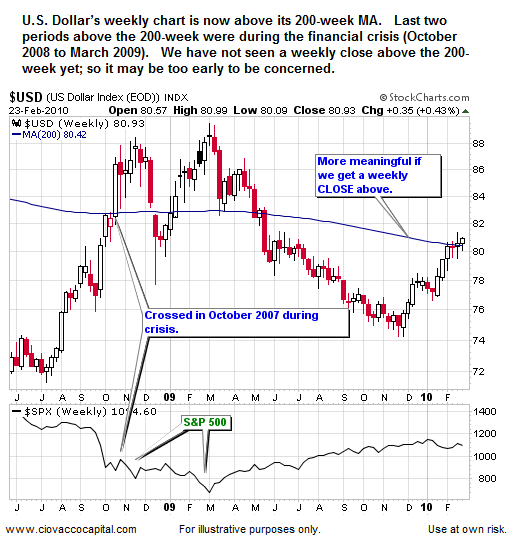
2010: The DollarProblems in Europe have contributed to some out of character moves in the U.S. Dollar relative to a typical market cycle. Greece's budget woes helped push the Dollar's intermediate low back more than two months relative to the 2003-2004 cycle. The Dollar's strength has hampered gains in commodities and emerging market stocks since mid-November 2009. That is the bad news. The good news is the Dollar's current rally may be relatively short-lived allowing for commodities and emerging markets to reassert their leadership sometime later in 2010 (maybe Q3 or Q4).Our current concern with the Dollar may also be supportive of a corrective process in risk assets (stocks, commodities, higher-yielding income instruments, etc.). The chart below is a weekly chart of the Dollar. The way to get the best read on a weekly chart is to wait to see how the chart looks at the end of the week. Since the concern outlined below relates to a move that has occurred this week, it may be premature to get overly defensive based on what we have seen so far this week (M-W). Should the Dollar close above its 200-week moving average (MA - see blue line in chart) at week's end, then it will be more significant. The S&P 500 is shown below the chart of the Dollar for comparison purposes.
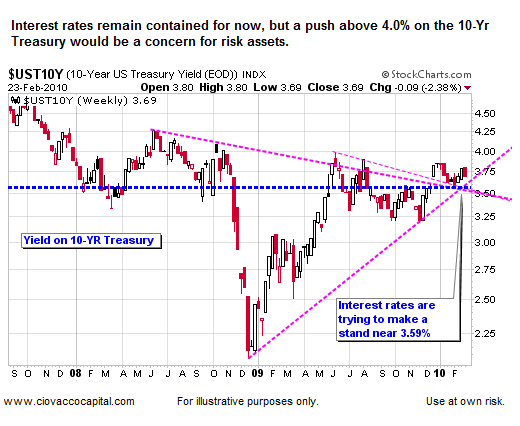
 2010: Interest RatesSometimes thinking in extremes can help illustrate financial market concepts. Assume in the current environment, a bank was offering FDIC-insured CDs paying 10% (and let's assume they are safe and secure). If we could get a CD paying 10%, we would probably be happy to move money out of the stock market to grab the "risk-free" return. The point is that rising interest rates eventually begin to pull money out of stocks and other risk assets. Therefore, we need to keep an eye on interest rates.
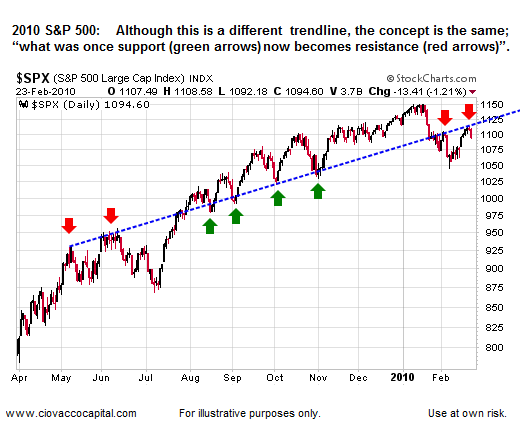
 Similar Concerns In Numerous MarketsWe maintain daily, weekly, and monthly charts for all our holdings and for numerous other markets. When we see similar set-ups on numerous charts and under various timeframes, we begin to pay closer attention. The chart below shows the correction of 2004 in the S&P 500. Notice how the blue trendline bounded corrections (support) on the way up in 2003. In 2004, "what was support (see 1 in chart) became resistance (see 2 in chart)." Once the blue line was defined as resistance in early Q2 of 2004, a correction followed with the S&P 500 making a series of lower lows (see pink arrows).
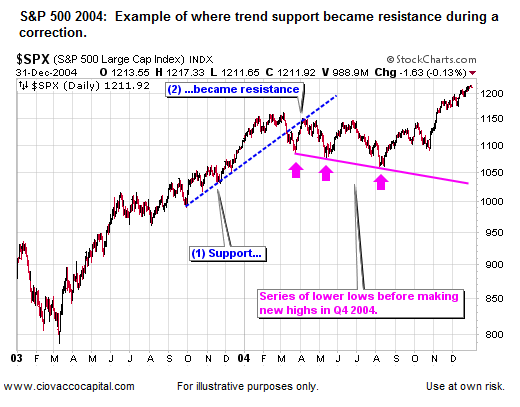 If, with an emphasis on IF, 2010 continues to follow the early stage bull market script, we may see one or two more lower lows (lower than the February 2010 low of 1,044 on the S&P 500). It is too early to overreact to the current set-ups, but it is not too early to consider reducing risk.
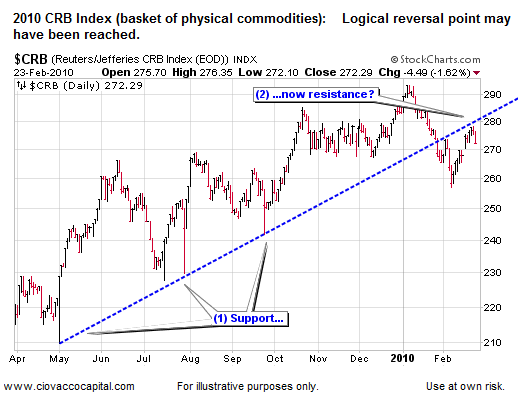
CommoditiesWith a stronger Dollar and the possibility of higher interest rates, the similarities between the chart of the S&P 500 in 2004 (above) and the charts of the CRB Index and copper (below) should be respected. If commodities can move higher in the coming days and weeks, our concern would be alleviated.
 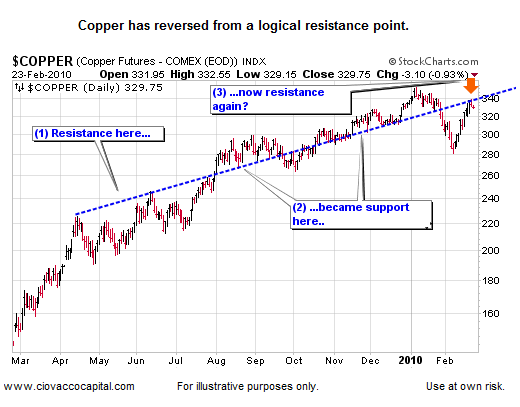 It is clear from the chart of copper above that some overhead resistance exists near 338. We do not know if the reversal at 338 is just a short-term event, or something that may be part of an intermediate trend change. Time will tell. If copper goes on to make new highs, then it may turn out to be a blip on the bullish radar.
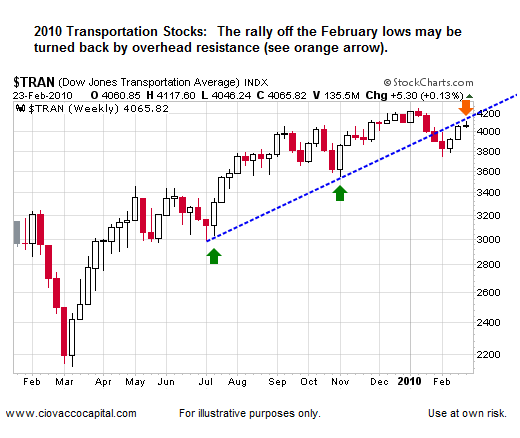
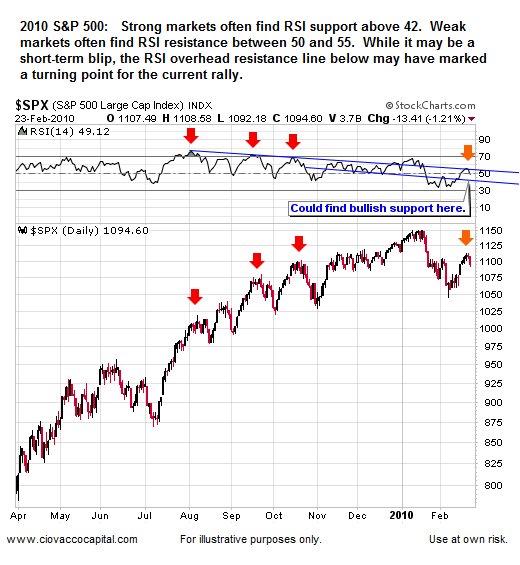
Stocks - Similar ConcernsNumerous markets, including the Dow, transportation stocks, and the S&P 500 also have some concerning developments on their charts.
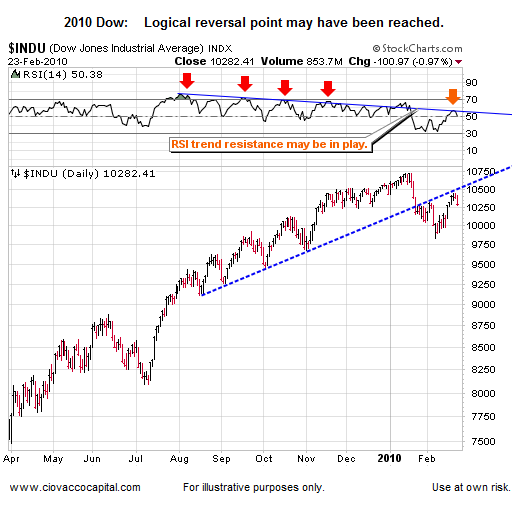  It is obvious the points shown below now represent points of overhead resistance; the question is how strong is the resistance and how long will it bound prices. Support and resistance trendlines become more relevant the more times price has come in contact with them. Notice in the chart below of the S&P 500 how many times and over how many months the trendline has been touched by price. In 2010, two advances have been turned back by the blue trendline (see two red arrows upper right of chart). This tells us that the blue trendline is meaningful to market participants. If prices can move above the trendline, it will be a positive since the trendline would then begin to act as support rather than resistance. The previous statement applies to all markets, not just stocks. Our task is not to predict, but to monitor as the process unfolds over the coming weeks. The longer markets remain below the trendlines, the more significant it becomes. Short stays below the trendlines would greatly reduce the probability of a corrective process unfolding over the next few months.
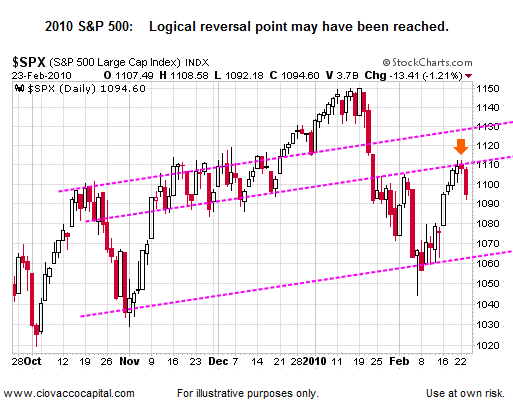
 For an intermediate trend change we need a discernable lower low and a discernable lower high. Therefore, if the current advance in the S&P 500 stalls discernibly below the January 2010 high of 1,150, the odds of a move below the recent low of 1,044 would increase. The lower high would not necessarily have to occur near current levels. Another logical point for a discernable lower low is near 1,130 on the S&P 500 (see top pink line in chart below).
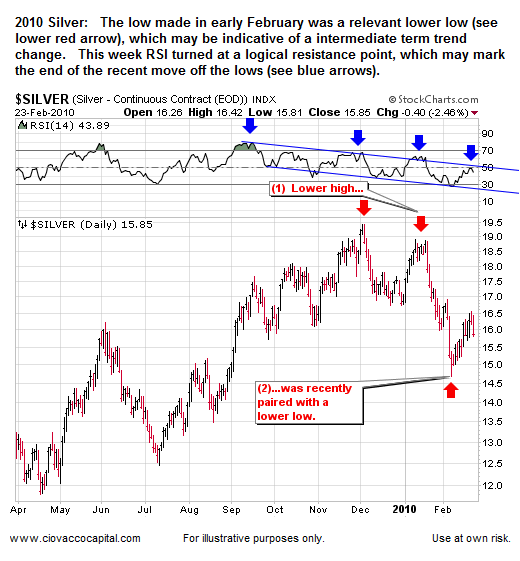
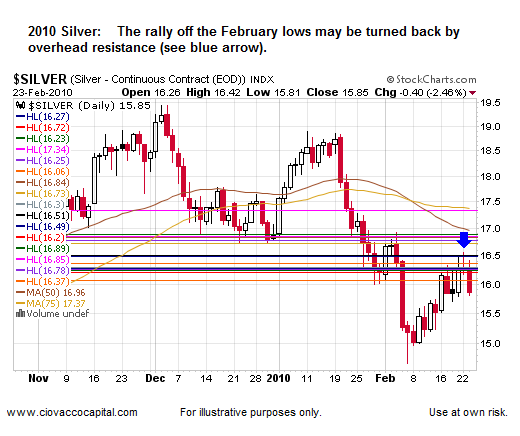
  Silver - Lower Low In FebruaryA healthy or up-trending market makes a series of higher highs and higher lows (see left side of chart below). A downtrend is defined by a series of lower highs and lower lows. With the recent low in early February, silver has now made a discernable lower high and lower low (see red arrows right side of chart below). The blue arrows are concerning as well with the RSI indicator reversing at a logical point. Silver is a volatile commodity so recent events may not be as important as they would be in most circumstances, but they need to be monitored in the context of a possible intermediate trend change.
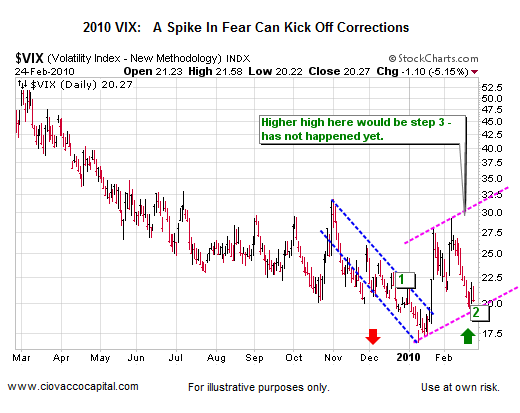
  2010 - VIX or "Fear Index"The VIX may be in the process of an intermediate-term trend change, which would support a corrective period in stocks. Three basic things need to occur for a change in trend (see labels on graph below): (1) a break of trendline, (2) a higher low, and (3) a higher high. Two of the three steps have been completed by the VIX. Another spike higher in the VIX could coincide with lower stock prices.
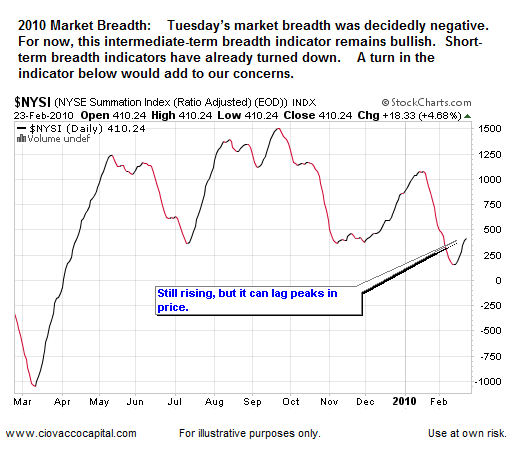
 Market Breadth - Still PositiveMarket breadth refers to the number of advancing stocks and the number of declining stocks. Healthy markets have positive market breadth meaning the majority of individual stocks are gaining ground, not just those in a major index.
 Interest Rates - One Bullish DifferenceIn 2004, the Fed raised interest rates in June. The odds of the Fed raising rates before June of this year are very low. Based on recent Fed statements, the earliest we would anticipate a hike in the Federal Funds Rate would be late September 2010. Given the fragile state of employment and the housing market, it is quite possible the Fed does not raise rates in 2010. This could open the door for stocks and commodities to rally to new highs in the coming months. This is a significant and potentially bullish difference between 2010 and 2004.
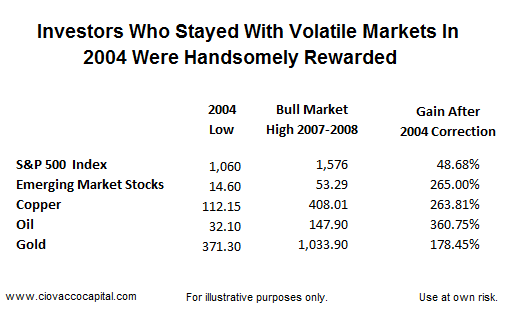
Reasons To Stay Focused On Longer-TermIt is possible that the coming months will continue to be frustrating and principal protection may become the highest priority for the short-to-intermediate term. If that is the case, many investors will let fear get the best of them and decide they have had enough, as many did in Q2 and Q3 of 2004. If a correction has begun, it may feel like a new bear market has started and the press will be happy to assist with our fear. History says a correction should not be the end of the bull market, but a launching pad to give patient investors the possibility for substantial gains once the last bear has sold out. Stocks corrected for eight months in 2004, breaking the resolve of many bulls. Unfortunately for those who sold out with no intention of reentering, the gains from the lows of 2004 to the bull market highs made in 2007-2008 were significant (see table below). In terms of the economic and market cycles, the parallels between 2004 and 2010 are strong.
 Additional comments can be found in Short Takes.
Chris Ciovacco
Chris Ciovacco is the Chief Investment Officer for Ciovacco Capital Management, LLC. More on the web at www.ciovaccocapital.com Terms of Use. The charts and comments are only the author's view of market activity and aren't recommendations to buy or sell any security. Market sectors and related ETFs are selected based on his opinion as to their importance in providing the viewer a comprehensive summary of market conditions for the featured period. Chart annotations aren't predictive of any future market action rather they only demonstrate the author's opinion as to a range of possibilities going forward. All material presented herein is believed to be reliable but we cannot attest to its accuracy. The information contained herein (including historical prices or values) has been obtained from sources that Ciovacco Capital Management (CCM) considers to be reliable; however, CCM makes no representation as to, or accepts any responsibility or liability for, the accuracy or completeness of the information contained herein or any decision made or action taken by you or any third party in reliance upon the data. Some results are derived using historical estimations from available data. Investment recommendations may change and readers are urged to check with tax advisors before making any investment decisions. Opinions expressed in these reports may change without prior notice. This memorandum is based on information available to the public. No representation is made that it is accurate or complete. This memorandum is not an offer to buy or sell or a solicitation of an offer to buy or sell the securities mentioned. The investments discussed or recommended in this report may be unsuitable for investors depending on their specific investment objectives and financial position. Past performance is not necessarily a guide to future performance. The price or value of the investments to which this report relates, either directly or indirectly, may fall or rise against the interest of investors. All prices and yields contained in this report are subject to change without notice. This information is based on hypothetical assumptions and is intended for illustrative purposes only. PAST PERFORMANCE DOES NOT GUARANTEE FUTURE RESULTS.
|

