|
Home
|
 Stock Market Trends: Importance and How to Monitor Their Health ATLANTA
Even Warren Buffet Needs TrendsEven a pure fundamentalist needs their investments to trend. If you think Coke stock is going to rise in next few years due to growth in China, whether you know it or not, Coke has to trend upwards for you to make money – it absolutely has to. If an investment needs to trend upwards to make money, it stands to reason that we need to complement our fundamental outlook with an excellent understanding of trends. The problem with using pure fundamental analysis is one of timing – until the market agrees with you, your analysis is not very useful. In the present day, many fundamentalists are calling for deflation (an argument we appreciate and understand). However, if the deflationists are correct eventually it has to show up in the asset markets. It may happen. It hasn’t happened yet – not with crude oil at $67 a barrel. The deflation case does not have technical alignment at the present time. The inflation case currently has technical alignment.From a fundamental perspective we have two primary drivers in the current market: While the U.S. economy remains weak and fragile, there is no question the economic numbers are improving albeit from very depressed levels. Even if we assume worse than expected economic news, we know what the response will be from policymakers – more government spending, more bailouts, low interest rate policies, and more money printing – all of which are inflationary and supportive of commodities, foreign stocks, foreign bonds, etc.. Additionally, we cannot rule out the possibility of deflation and inflation occurring simultaneously in the economy. Commodity prices may experience inflation. Wages may get hit with deflation. If governments create enough new money, eventually it will make its way into the economy. When it does, it will be looking for a home. One thing that takes a few years to appreciate when working on Wall Street is the impact of monetary and fiscal policies on asset prices. Is it possible the inflationary policies will fail? Yes, and if they do it will be easy to see in the financial markets. If crude oil makes new lows and emerging market stocks make new lows, it will be a clear signal that deflation is ruling the day. Even if we eventually get high CPI inflation, it will take some time to appear, which means all asset classes could benefit for a time, including U.S. stocks. If inflation starts to get out of hand in a few years, stocks could very well lag commodities by a wide margin. For now, the markets are sending a clear signal that inflation has a chance to take hold. If those signals change, trends in the charts below will begin to fail and the U.S. dollar may strengthen again for a time. If the deflationists are right, crude oil will give us plenty of warning ahead of time. Like oil, the chart of the U.S. dollar is not currently pointing to deflation.
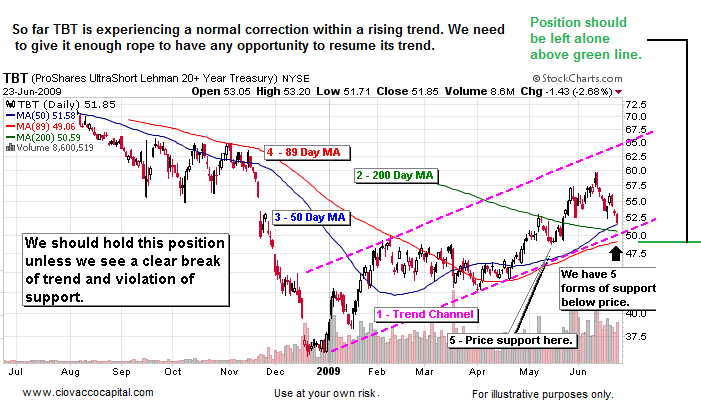
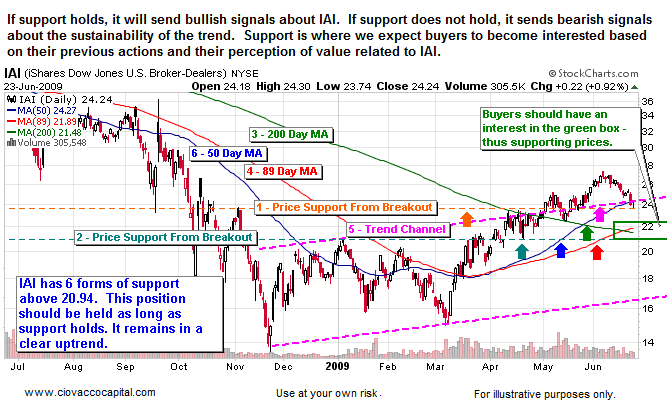
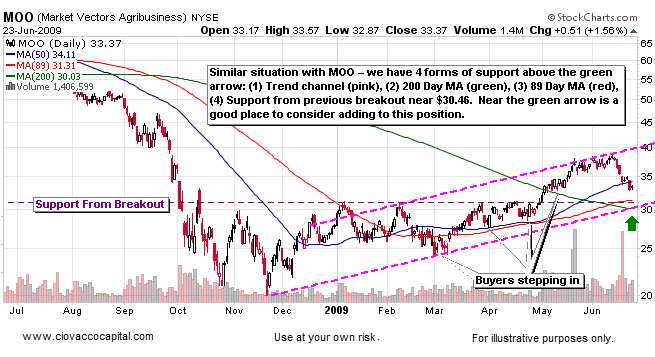
Monitoring TrendsIf our goal is to stay with a trend as long as possible and ignore volatility and corrections, how do we know when a possible disruption to a trend is taking place? We use monthly, weekly, and daily charts to help us monitor trends. The methods shown below are a small sampling of what we do, but they can help you better understand how much rope we plan to give some of our current holdings and a sample of the rationale behind it. We rely more heavily on monthly and weekly charts since they help us filter out some of the noise and focus on what we care about – the longer-term. We present daily charts below since they are the most common. We are not attempting to trade trend channels, we are attempting to identify, enter, and stay with the strongest trends.
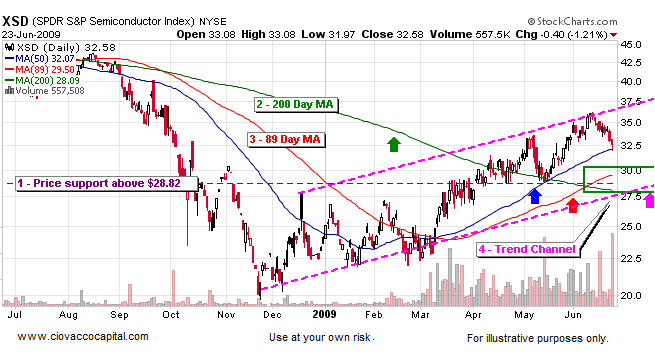
 Comments for XSD chart below: It is common for corrections to give back 38.2% to 50.0% of the prior move. A 38.2% retracement of the gains from the March lows would take us back to $30.50. We also have support at $32.07 in the form of the 50-day MA (blue line). A 50% retracement would take us to $29.05, which is complemented by possible support from the 89-day MA at $29.50 (red line) and the 200-day MA at $28.09 (green line). Price support exists at $28.82 (purple line). The bottom end of the trend channel (pink line) also comes up to meet the 200-day MA. If the correction continues, we would expect to see buyers enter the market somewhere inside the green box. We should hold this position as long as support below holds.
 As the price of one of our investments drops, it is normal for us to experience fear. The further it drops, the more fearful the typical investor becomes. Rather than focusing on price alone, we need to focus on the trend. We should ask ourselves, is there a compelling reason to exit this trend? Is there evidence that a trend change may be taking place? If the answer is no, in most cases we need to stay with our strategy. Money management comes into play at some point, but we can give smaller positions more rope since the impact on our entire portfolio value is reduced. As stated recently in Short Takes, if your investments fall 12%, but you have 50% of your account in cash, the loss relative to your entire portfolio is 6%. This is why we took some very small positions in recent weeks – some as small as 1% of a portfolio. We can give a 1% holding quite a bit of rope with a limited impact on our principal. A 10% position has to be given 10 times less rope.
 A few important points related to entering markets:
We are experiencing the aftermath of a once in a lifetime credit event. It is never easy transitioning from a bear market to a bull market. Under the circumstances and given the rapid descent during the bear market, followed by a extremely rare and powerful “V” shaped rally off the bear market low, the current environment is especially challenging. We remain confident that hard work and discipline will allow us to make good decisions regardless of whether we have started a new bull market or if the bear returns.
Given the pullbacks in recent days, we thought it might be beneficial to provide you with one of the many ways we monitor our positions. When markets correct, it is important to review your basic strategy in order not to get emotionally involved with day-to-day volatility and normal corrections. Our basic approach to the markets can be summarized as follows:
Chris Ciovacco
Chris Ciovacco is the Chief Investment Officer for Ciovacco Capital Management, LLC. More on the web at www.ciovaccocapital.com All material presented herein is believed to be reliable but we cannot attest to its accuracy. The information contained herein (including historical prices or values) has been obtained from sources that Ciovacco Capital Management (CCM) considers to be reliable; however, CCM makes any representation as to, or accepts any responsibility or liability for, the accuracy or completeness of the information contained herein or any decision made or action taken by you or any third party in reliance upon the data. Some results are derived using historical estimations from available data. Investment recommendations may change and readers are urged to check with tax advisors before making any investment decisions. Opinions expressed in these reports may change without prior notice. This memorandum is based on information available to the public. No representation is made that it is accurate or complete. This memorandum is not an offer to buy or sell or a solicitation of an offer to buy or sell the securities mentioned. The investments discussed or recommended in this report may be unsuitable for investors depending on their specific investment objectives and financial position. Past performance is not necessarily a guide to future performance. The price or value of the investments to which this report relates, either directly or indirectly, may fall or rise against the interest of investors. All prices and yields contained in this report are subject to change without notice. This information is based on hypothetical assumptions and is intended for illustrative purposes only. PAST PERFORMANCE DOES NOT GUARANTEE FUTURE RESULTS.
|
