|
Long-Term Investors Need Trends to Make Money Most of us would prefer to be investors instead of traders. Investors, with an intermediate to long-term time horizon, must be aligned with a positive trend in order to make money. This is true even for value investors who focus on a company's valuation rather than a trend that can be seen on a chart. For the value investor to make money, eventually the position must turn up.
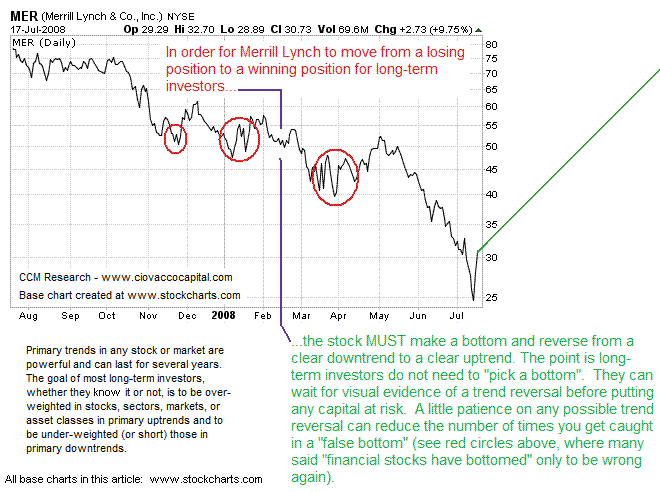
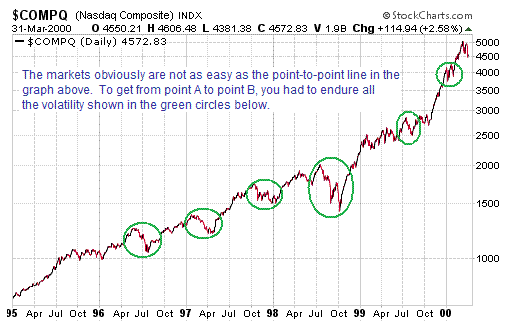
The chart above is not designed to convey that spotting a trend reversal is easy. It is not, but as more evidence gathers as to the probable legitimacy of the new trend, the less risk you need endure to participate. If the stock or market does not trend upward for a significant period of time, long-term investors do not want to participate. The point is you can afford to miss the early part of the new trend. Let the traders show us the way while putting their capital as higher risk. The strategies and goals of shorter-term traders are quite different from those of a long-term investor. When you understand this, it becomes clear that many buyers at a "bottom" are traders who have no intention of keeping the stock for a long-term investment, which means they will be happy to sell at the first sign of trouble (creating many false bottoms). Long-term investors do not necessarily want to enter a market at the same time as traders who have much shorter holding periods. This concept currently applies to the ETFs SPY, QQQQ, DIA, XLF, EFA, and the list goes on. Volatility and Risk Management While Capturing a Trend Depending on how you manage it, volatility can be your friend or your enemy when attempting to make money in financial markets. Fear is an investor's biggest enemy and volatility is what drives fear. To remind everyone of what could be at stake here and what can happen in bear markets, below are the devastating losses suffered in the S&P 500 (SPY) and NASDAQ (QQQQ) during the 2000-2002 bear market.
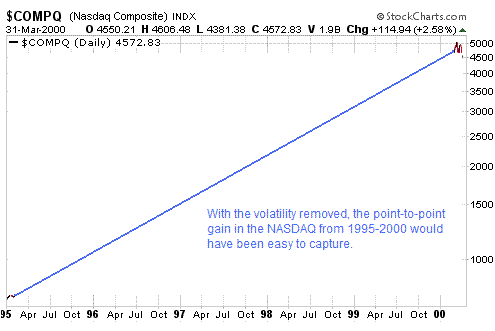
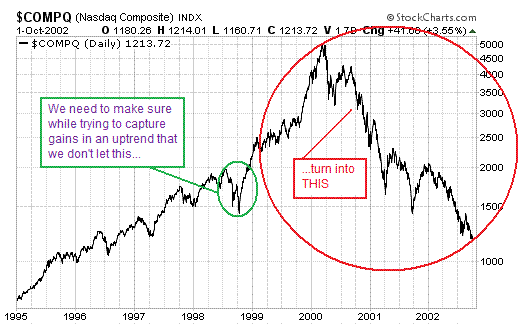
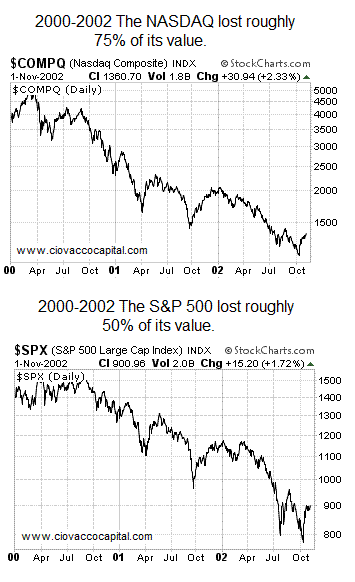 It is evident above that volatility should be respected since losses can wipe out years of hard work if a portfolio manager does not adopt proper risk management measures. How can volatility be our friend? Those who study and understand the volatility characteristics of any investment or market will have a much better chance of staying with and capturing the gains available in long-term trending markets. As illustrated in Chart A below, any investor would have loved to ride the NASDAQ's meteoric rise from 1995 through the first quarter of 2000. I have removed the volatility from Chart A to illustrate a trending market without the gut-wrenching and emotional effects of the market's inevitable ups and downs within the context of the primary trend. Our goal is to stay in an upward trending market long enough to profit, while not staying invested too long during what appears to be more than a "normal" correction (see Chart C).
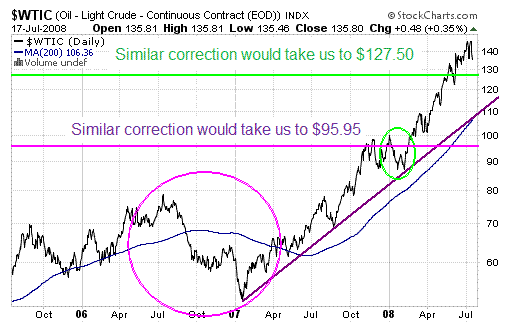
Chart D (below) shows both the current uptrend in oil (USO) and recent corrections within the context of the uptrend. The percentage drop in the large pink circle from peak to trough was 34%, but those who held even a reduced position were able to profit from the remainder of the trend. The percentage drop in the green circle was 13%, but those who held on through the correction were able to profit. If oil dropped 12% from its recent peak of $145 it would fall to $127.50. If oil dropped 34% from its recent peak, it would fall to $95.95. In a form more simple than how we would actually make decisions, an investor in oil should not get too concerned until $127.50 is taken out on the downside. Based on your risk tolerance, you may decide to cut back on your holdings below $127.50. If $95.95 is violated on the downside, it is possible you would exit the entire position or at least make a significant reduction in your exposure.
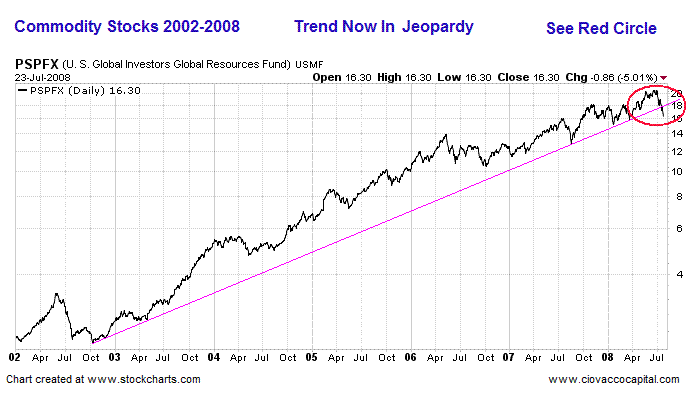
In the real world, a portfolio manager would use several factors to make calls on when to cut back or exit a position. If trend lines are broken that adds to the negative evidence. If an investment has had an extended run, like oil, the manager may be more inclined to cut back earlier rather than later. Fundamental factors come in to play as well. The cons for oil are the reduction in demand that comes during periods of economic weakness and the aforementioned long in the tooth trend. The pros for oil are well known; questions about supply and increased demand from China, India, etc. Let�s Put Some Charts on a Wall As shown in the chart below of a resource stock mutual fund, the long-term trendline from 2002 in commodity stocks has been breached. The closing price of PSPFX has now breached levels which move the current declines beyond a "normal correction" for this investment. While we are not calling a top, the evidence we have should be used in your risk management efforts.
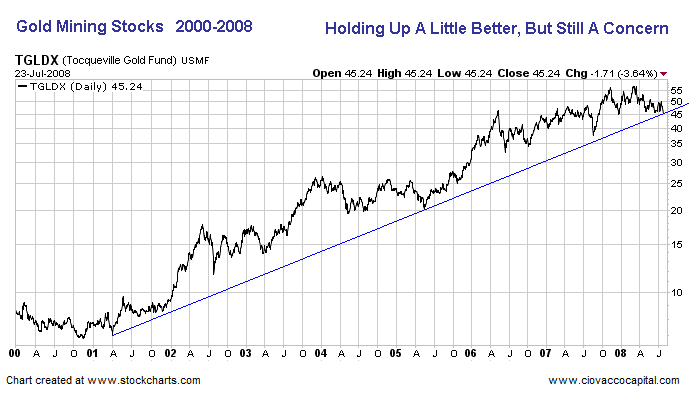
It is worth keep an eye on the depth of the current pullback in gold mining stocks. A new high in TGLDX, a mutual fund, has not been made in quite some time.
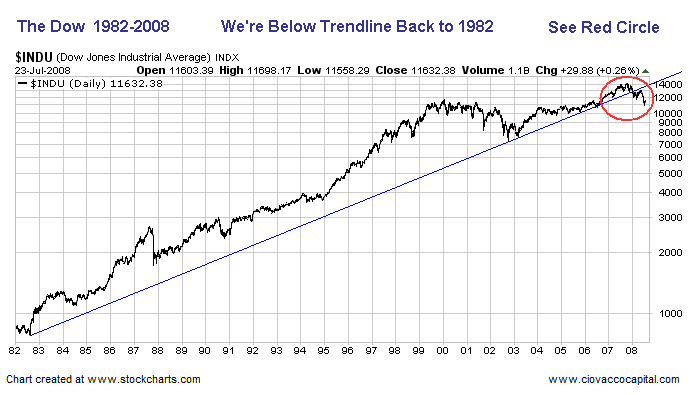
The great bull market in stocks began in 1982 after years of lackluster inflation adjusted returns. The chart below shows the trendline from 1982 has now been broken.
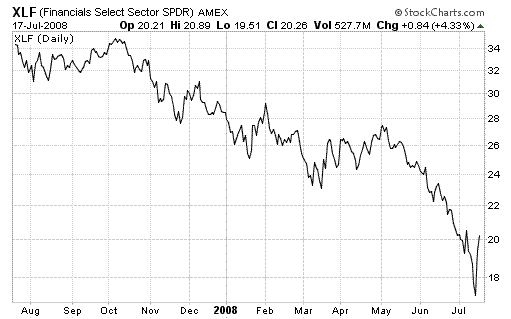
While financial stocks have hit a violent intermediate bottom and could rally for a while longer the odds favor lower lows in the months ahead as housing prices continue to decline. The chart below illustrates the structural nature of the problems facing the housing and financial industry. There are fundamental reasons financial stocks have been hit so hard, reasons which go way beyond short selling. Additional bank failures in the coming months would not come as a surprise, which is supported by the rapid deterioration of the sector. Since our economy has become so dependent on the availability and use of credit, these problems will continue to impact U.S. and global growth.
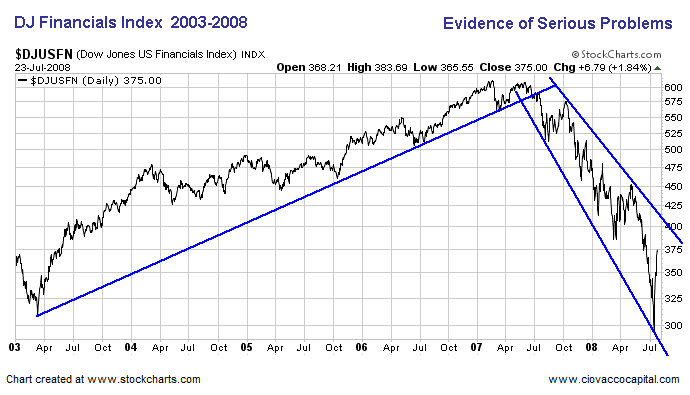
A recent Bloomberg article illustrates the vast difference between supply and demand in housing. The banks and GSEs (Fannie & Freddie) are overloaded with foreclosures. Vandals often step in making homes near impossible to sell.
July 23 (Bloomberg) -- Fannie Mae, the largest U.S. mortgage finance company, couldn't find a buyer who would pay $6,900 for the three-bedroom house at 1916 Prospect St. in Flint, Michigan. So broker Raymond Megie, who is handling the foreclosure sale, advised cutting the price to $5,000. Megie still couldn't sell it. "There's oversupply," he said. The home sold in 2005 for $110,000. Banks around the globe, especially in Europe, are facing similar problems with mortgage losses.
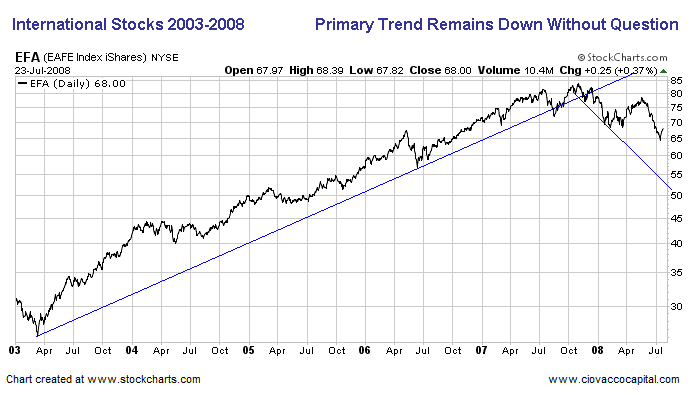
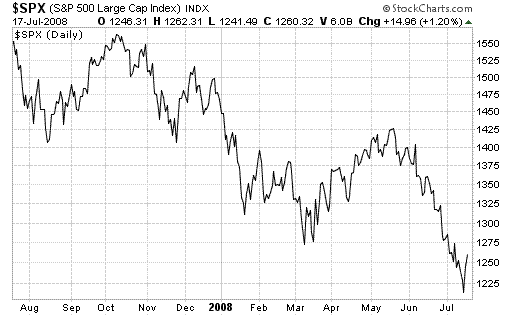
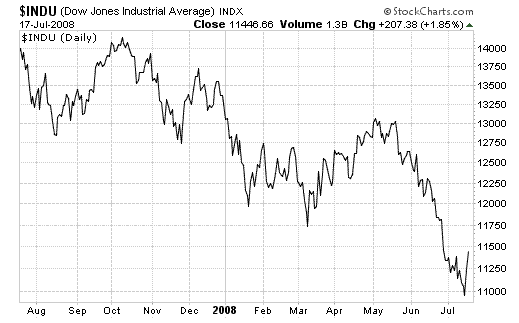
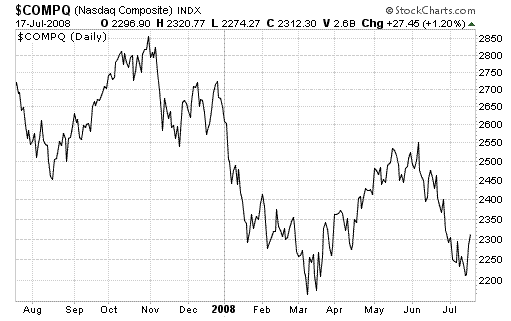
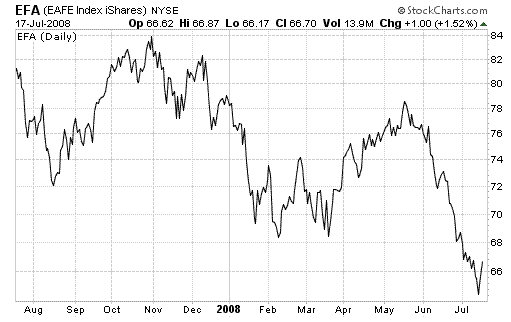
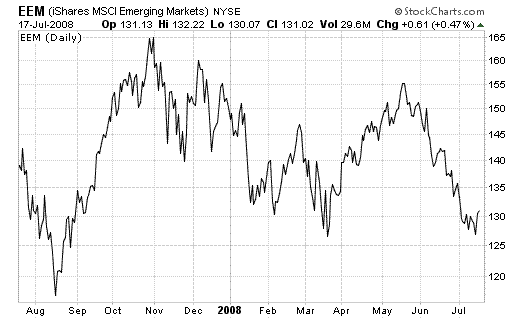
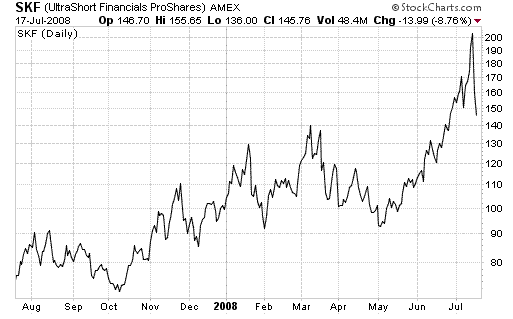
I once read where a very successful money manager said he liked to invest in trends where if he printed a graph and taped it to the wall, he would be able to spot the trend from across the room. Let's tape up some charts to get a read on the current state of the world. The charts below are one-year charts which are more relevant to your current portfolio. We�ll start with global stock markets since most investors who wish to grow and protect their purchasing power tend to invest in stocks. Related EFT symbol is shown in parenthesis.
All material presented herein is believed to be reliable but we cannot attest to its accuracy. The information contained herein (including historical prices or values) has been obtained from sources that Ciovacco Capital Management (CCM) considers to be reliable; however, CCM makes any representation as to, or accepts any responsibility or liability for, the accuracy or completeness of the information contained herein or any decision made or action taken by you or any third party in reliance upon the data. Some results are derived using historical estimations from available data. Investment recommendations may change and readers are urged to check with tax advisors before making any investment decisions. Opinions expressed in these reports may change without prior notice. This memorandum is based on information available to the public. No representation is made that it is accurate or complete. This memorandum is not an offer to buy or sell or a solicitation of an offer to buy or sell the securities mentioned. The investments discussed or recommended in this report may be unsuitable for investors depending on their specific investment objectives and financial position. Past performance is not necessarily a guide to future performance. The price or value of the investments to which this report relates, either directly or indirectly, may fall or rise against the interest of investors. All prices and yields contained in this report are subject to change without notice. This information is based on hypothetical assumptions and is intended for illustrative purposes only. PAST PERFORMANCE DOES NOT GUARANTEE FUTURE RESULTS.
|