|
Home
|
 Study: Significance of a Turn-Up of the 200-day Moving Average Stock Market: Moving Average Slope Study CCM - ATLANTA
Stock Market Gains After 200-Day MA Turns Up (Slope)
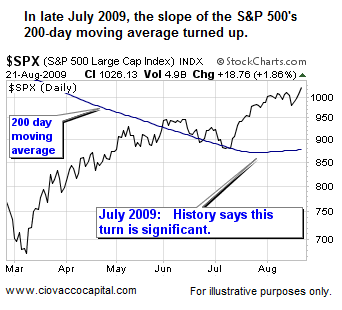 The 2007-2009 bear market ended after a 57% decline which took 517 calendar days to complete. In order to understand the historical significance of the recent turn in the S&P 500's 200-day SMA, we studied turns in the 200-day following bear markets similar to our recent experience. We studied prior bear markets in the Dow (1929-1950) and S&P 500 (1950-2003):
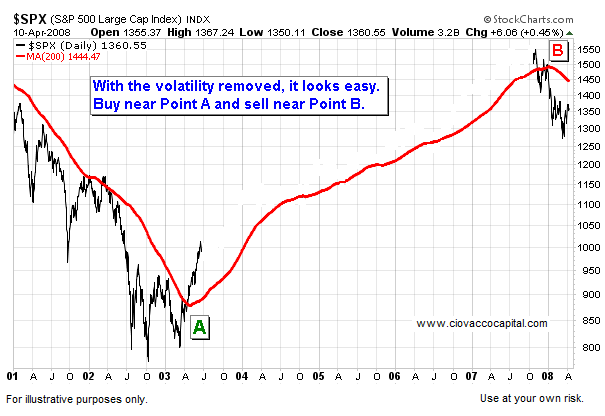
Five cases meet the criteria above since 1929; following the lows in 1932, 1942, 1970, 1974, and 2002. Chart 1 shows the composite performance 315 trading days after the 200-day moving average turned up in the Dow (1929-1950) or S&P 500 (1950-2009) following bear market declines of 35% or more. The composite graph below shows the average path of the five cases cited after the 200-day moving average turned up, NOT from the market bottom. The study assumes you "missed the bottom" and entered the market after the 200-day moving average turned up. In 2009, the 200-day moving average turned up on July 29th when the S&P 500 was trading at 975, which is represented hypothetically by Point A below. If the market follows the historical composite, Point B hypothetically would occur in the fall of 2010.
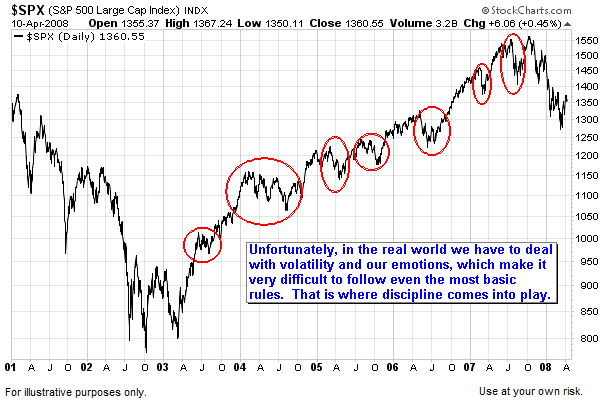
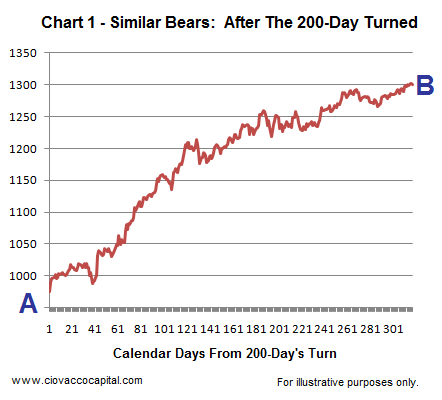 As shown in the composite graph above (chart 1), it can be rewarding to be invested after the slope of the 200-day moving average turns positive following a major bear market. Note the correction in the composite graph just prior to the strong rally. We may experience a similar "shake out" correction in August or in the fall of 2009, where the market shakes out investors just prior to a big move. More detailed information cocerning this study and the transition from a bear to a bull can be found in Evidence of New Bull Markets & Favored Asset Classes. "The worst recession since the Great Depression is likely coming to an end," says Sung Won Sohn, economics pro-fessor at California State University. Friday's better-than-expected July jobs report fanned hopes for a recovery, as did a report a week earlier showing the economy shrank less than expected in the second quarter.
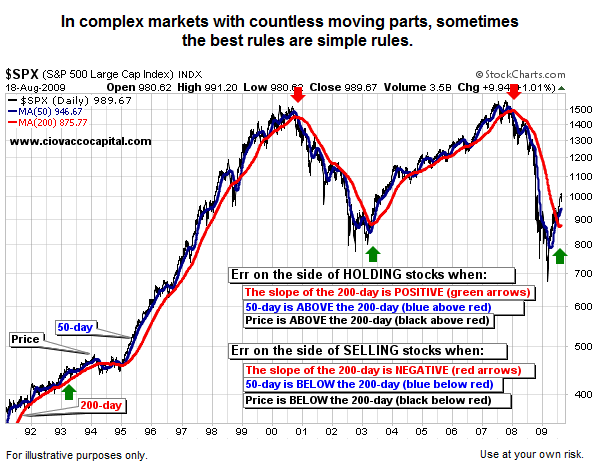
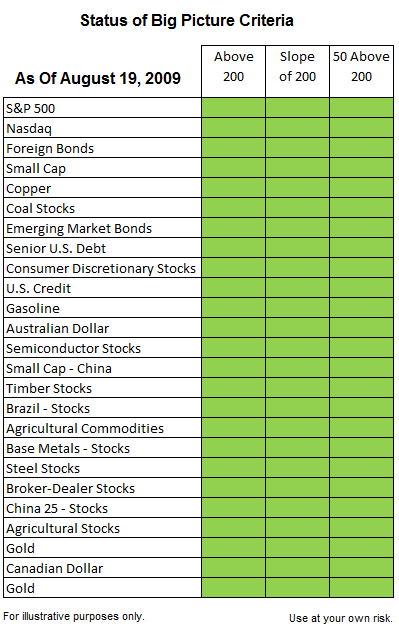
Corrections Are A Part Of All Bull MarketsWhen corrections are in full swing, it always makes sense to review the big picture. We have covered the topics below numerous times in the past, but we will do so again because they remain important and they can help us deal with our biggest enemy – our emotions. The rules below are far from the only way to make buy and sell decisions, but they do serve as a big picture framework to help us make better calls during corrections. The final chart will show the state of the current financial landscape within the context of the rules.
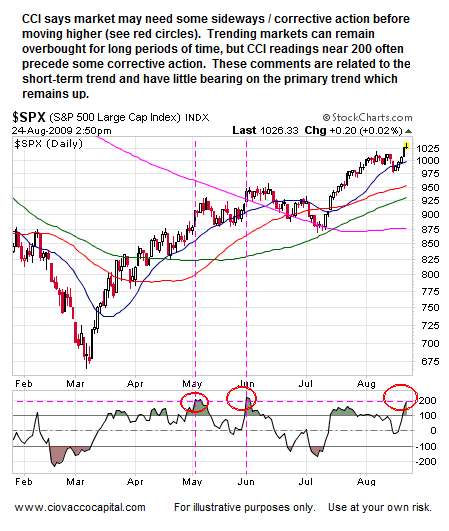
While it has little impact on the primary trend, the S&P 500 looks a little tired as of August 24, 2009.
Global stock markets remain in a state of positive fundamental and technical alignment, which has bullish implications for the next six to eighteen months. In this article, we will explore:
Improving Fundamentals: Last week, leading economic indicators (LEIs) posted their fourth consecutive monthly gain. Global LEIs recently posted their biggest monthly gain since 1975. Going forward, low earnings expectations (relative to the prior year), which we have now, often result in positive earnings surprises as we leave a recession. Positive earnings surprises can help push markets higher.
Positive GDPs Numbers On The Way?Weekly jobless claims can help us possibly spot the end of a recession. Initial claims peaked in the first quarter of this year and have since declined significantly. Businesses reduced inventories at a record pace in the last two quarters. Rebuilding of inventories in the coming quarters will add to GDP. Car and truck sales were hit hard during the recession. Increased sales helped by the clunkers program will also be a positive for GDP. Government spending, one of the few bright spots in GDP in recent quarters, should continue as planned stimulus spending hits a high water mark in 2010. Housing has been a negative component of GDP for numerous quarters. Recent data suggests housing’s drag on GDP should lessen or even become additive in future quarters. From a historical standpoint, steep economic downturns are usually followed by better than expected recoveries. The recent financial meltdown certainly qualifies as a steep downturn. Above are excerpts taken from the August 2009 - Asset Class Outlook, which is available for download. The comments above and those in the outlook are intended for CCM clients, and thus investments or strategies described may be inappropriate for some investors based on their own individual situation and risk tolerance.
Chris Ciovacco
Chris Ciovacco is the Chief Investment Officer for Ciovacco Capital Management, LLC. More on the web at www.ciovaccocapital.com All material presented herein is believed to be reliable but we cannot attest to its accuracy. The information contained herein (including historical prices or values) has been obtained from sources that Ciovacco Capital Management (CCM) considers to be reliable; however, CCM makes any representation as to, or accepts any responsibility or liability for, the accuracy or completeness of the information contained herein or any decision made or action taken by you or any third party in reliance upon the data. Some results are derived using historical estimations from available data. Investment recommendations may change and readers are urged to check with tax advisors before making any investment decisions. Opinions expressed in these reports may change without prior notice. This memorandum is based on information available to the public. No representation is made that it is accurate or complete. This memorandum is not an offer to buy or sell or a solicitation of an offer to buy or sell the securities mentioned. The investments discussed or recommended in this report may be unsuitable for investors depending on their specific investment objectives and financial position. Past performance is not necessarily a guide to future performance. The price or value of the investments to which this report relates, either directly or indirectly, may fall or rise against the interest of investors. All prices and yields contained in this report are subject to change without notice. This information is based on hypothetical assumptions and is intended for illustrative purposes only. PAST PERFORMANCE DOES NOT GUARANTEE FUTURE RESULTS.
|
