Ciovacco Capital Management, LLC is an independent financial advisor based in Atlanta, Georgia. Helping investors cope with the new reality of a flat world, CCM helps individual investors, large & small; achieve improved investment results via research and globally diversified investment portfolios. Since we are a fee-based firm, our only objective is to help you protect and grow your assets. Our long-term, theme-oriented, buy-and-hold approach allows for portfolio rebalancing from time to time to adjust to new opportunities or changing market conditions. When looking at financial advisors in Atlanta, take a hard look at CCM - Financial Advisor Atlanta.


By Chris Ciovacco
September 19, 2006
Page 1 of 2
EXECUTIVE SUMMARY
- The correlation since 1996 to between a weakening housing market and the stock market suggests that a defensive investment stance is prudent at the present time.
- IMPORTANT: Investors should also be aware that housing and stocks do not have a meaningful correlation prior to 1996. Based on the recent wave of "cash out" refinancing, a general boom in the mortgage business, and the feel good wealth effect created by rising housing prices, it is difficult to ignore the possible negative impact to the overall economy as housing continues to slow.
- While the recent advance in stocks is impressive on the surface, a more detailed look yields some cause for skepticism.
- History tells us that the probability of the Federal Reserve being able to engineer a soft landing in the housing market is very low.
- The economic impact of the recent housing boom has been greater than even the largest stock market booms. It will be difficult, if not nearly impossible, to replace this economic activity from another sector of the economy.
- Since the interest rate cycle should be similar to what followed the Interest bust, a detailed review (see charts on page 2) of asset class and investment performance between March of 2000 and October of 2002 can help investors make better decisions should the stock market peak in late 2006 or early 2007.
- Since history rarely repeats itself in exact form (especially in the financial markets), it is also prudent to look at some possible differences between the previous cycle and our current environment.
Housing Has A Strong Correlation To Stocks
As shown by the National Association of Homebuilders (NAHB) Homebuilders Index (see blue line in chart above), the slowdown in housing has now reached significant levels. NAHB produces the Housing Market Index (HMI), a weighted, seasonally adjusted statistic derived from ratings for present single-family sales, single-family sales in the next six months, and buyer traffic. A rating of 50 indicates that the number of positive or good responses received from the builders is about the same as the number of negative or poor responses. Currently, the weighted rating is firmly in the negative camp at 32. This represents a pessimistic outlook for real estate in the next six months, which in turn is not good for stocks. The chart above was taken from a report by David Rosenberg, North American economist for Merrill Lynch. Mr. Rosenberg comments on how the weak housing market may affect stocks:"The chart above is rather intriguing - the NAHB homebuilders index leads the S&P 500 by 12 months and with a near-80% correlation - a correlation that over time has actually strengthened, owing to the growing influence that the real estate market has exerted on the overall economic and financial landscape over the past five years. In fact, we can trace almost two-percentage points of the 3 1/2% average annual rate in real GDP over that time frame to the boom in housing construction and home prices - the direct impact on homebuilding, the spin-offs to other sectors like real estate services, architecture, engineering, legal, etc and the multiplier impact from the 'wealth effect' on consumer spending, especially on home improvements and household furnishings."
The statement above means that during the past five years housing has either directly or indirectly accounted for 57% of economic activity. The latest release of new home sales shows a 21% year-over-year decline (view PDF report).
Using the 12-month lag of the S&P 500 as shown in the chart above, the actual correlation between the S&P 500 and the homebuilders index is .79, which would give us the following calculation to forecast where the S&P 500 may be 12 months from now (roughly August 31, 2007):
That is a sobering stat. While I am not forecasting that the S&P 500 will be 41% lower a year from now, I am in the camp that believes it is prudent to take a more defensive posture with our investment portfolios. This is a correlation that cannot be ignored by investors.
It is also interesting to note that the last intermediate peak in the homebuilders index was made in October of 2005. This means according to the 12-month lagging correlation the S&P 500 would hit an intermediate peak sometime in or near October of 2006. As the chart below illustrates, most recessions have been preceded by a period where housing prices decline (prices shown are adjusted for inflation - recessions are shown by shaded areas).
The Recent Advance In Stocks Is Suspect
While the recent advance in stocks is somewhat impressive, the statistics below the surface paint a picture which warrants concern about the sustainability of the rally. We have not seen figures in volume, new highs vs. new lows, common stocks vs. preferred stocks, etc., that produce a favorable risk/reward profile for taking substantial risk in the general stock market at the present time. Dr. John Hussman covers this topic in more detail in his article "A House Built On Sand", which contains the two informative charts below (my comments have been added to charts):
The U.S. stock market has gone over three years without a 10% correction. This has happened only three other times in modern market history. The average decline after the previous three runs was over 18%.
It Will Be Hard For The Fed To Bail Out The Housing Market
We are all hoping for the proverbial soft landing in housing, which in turn would enable a soft landing to take place in the economy as measured by GDP (the value of all good and services produced in the U.S.). If we use the boom in Internet stocks as a proxy, it is difficult to assume we will get the soft landing in housing. The chart below, taken from an August 2005 article in Forbes magazine, shows the Internet boom and the housing boom side by side. Fueled by low interest rates and thus cheap access to credit, the similarity between the two booms is striking.
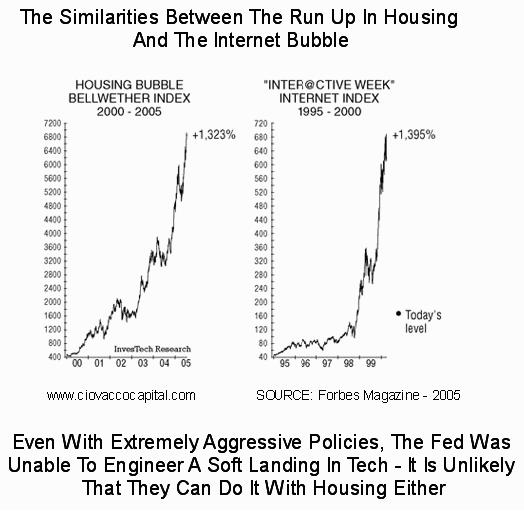
Once the Internet bubble started to burst, the Federal Reserve tried to engineer a soft landing by cutting interest rates 11 times in just 12 months, moves which are still without precedent today. Despite this aggressive action, we all know that the proverbial soft landing did not occur in the Internet space. The bond market's recent gains in price are signaling that the Fed may be lowering rates in the future in an attempt to slow the tide of the housing decline.
The media and Wall Street are always hoping for the soft landing or "Goldilocks" economic scenario. Unfortunately, the odds are stacked against having a soft landing after a series of interest rate hikes. During the last 16 interest rate cycles, there has been a grand total of one soft landing (see 1994). Using this one historical fact, there is a 6.25% (1/16th) probability that we get a soft landing. With these odds is it worth taking on too much risk with your hard-earned investment dollars?
The Economic Impact Of The Housing Boom
Economic gains in the United States in recent years have relied heavily on the rapid appreciation in the housing sector. According to a report on housing from Scotiac Capital:"Consumer spending on furniture and household equipment has grown at more than 3 1/2 times the pace of the overall economy during the current expansion, accounting for a 14% share of overall growth (nearly three times its share of the economy). Growth in residential investment has been double that of the overall economy during the same period, accounting for 10% of overall growth (compared with a 5% share if the economy). Finally, the construction, home improvement, and real-estate related sectors accounted for nearly 20% of overall private sector job creation in 2004 and 2005, double their share of private sector employment. Considering the amount of housing-related stimulus the economy has enjoyed in recent years, we expect a noticeable deceleration in the pace of real GDP growth over the forecast period - from the +31/2 average of the past three years to something closer to +2 1/2."
Forbes makes an argument that the overall economic impact of the recent housing boom is greater than the largest ever stock-related booms:
"The total value of residential property in developed countries has increased from $40 trillion to $70 trillion over the past five years (8.2000 to 8.2005), which (as The Economist points out) represents a larger potential bubble in terms of equivalent gross domestic product than either of the stock market bubbles of 2000 or 1929."

Page 1 of 2
Chris Ciovacco is the Chief Investment Officer for Ciovacco Capital Management, LLC. More on the web at www.ciovaccocapital.com
All material presented herein is believed to be reliable but we cannot attest to its accuracy. Investment recommendations may change and readers are urged to check with their investment counselors and tax advisors before making any investment decisions. Opinions expressed in these reports may change without prior notice. This memorandum is based on information available to the public. No representation is made that it is accurate or complete. This memorandum is not an offer to buy or sell or a solicitation of an offer to buy or sell the securities mentioned. The investments discussed or recommended in this report may be unsuitable for investors depending on their specific investment objectives and financial position. Past performance is not necessarily a guide to future performance. The price or value of the investments to which this report relates, either directly or indirectly, may fall or rise against the interest of investors. All prices and yields contained in this report are subject to change without notice. This information is based on hypothetical assumptions and is intended for illustrative purposes only. THERE ARE NO WARRANTIES, EXPRESSED OR IMPLIED, AS TO ACCURACY, COMPLETENESS, OR RESULTS OBTAINED FROM ANY INFORMATION CONTAINED IN THIS ARTICLE.
Ciovacco Capital Management, LLC is an independent money management firm based in Atlanta, Georgia. CCM helps individual investors and businesses, large & small, achieve improved investment results via research and globally diversified investment portfolios. Since we are a fee-based firm, our only objective is to help you protect and grow your assets. Our long-term, theme-oriented, buy-and-hold approach allows for portfolio rebalancing from time to time to adjust to new opportunities or changing market conditions.
Map & Location Info - CLICK HERE